Missing Heat

Scientists search the deep oceans to balance Earth’s energy budget.

When the mercury thermometer was invented in 1714, it took the scientific world by storm. On his transatlantic crossing in the year 1724, Benjamin Franklin recorded water temperatures by periodically dipping a thermometer into the ocean. By 1850, weather stations across the globe had gleaned a record of air temperatures over land. For the first time, scientists could track Earth’s temperature. And over time, it became clear that temperature was rising.

But after rapid warming in the 1980s and 1990s, the rate seemed to slow. Continued high continental temperatures were offset by curiously cool ocean surfaces. Yet most scientific evidence, and the inexorable increases in heat trapping greenhouse gases, indicated global temperatures should be climbing at a greater rate. This missing heat had to go somewhere—if not in the surface layers, where?

image
Image Caption

Moist air coming off the ocean produces clouds along the Big Sur coast south of Monterey, California. (Courtesy R. Schwemmer, National Oceanic and Atmospheric Administration)

Accounting for heat

Richard Allan, a professor of climate science at the University of Reading, contends the heat is not really missing. “People are looking for a simple explanation of where the heat is going,” Allan said. “But I think it’s a combination of factors.” Understanding these factors required tallying Earth’s entire energy balance: how much sunlight enters Earth’s atmosphere, how much of this energy is reflected and emitted back out to space, and where energy—in the form of heat—is being stored in Earth’s climate system.

image
Image Caption

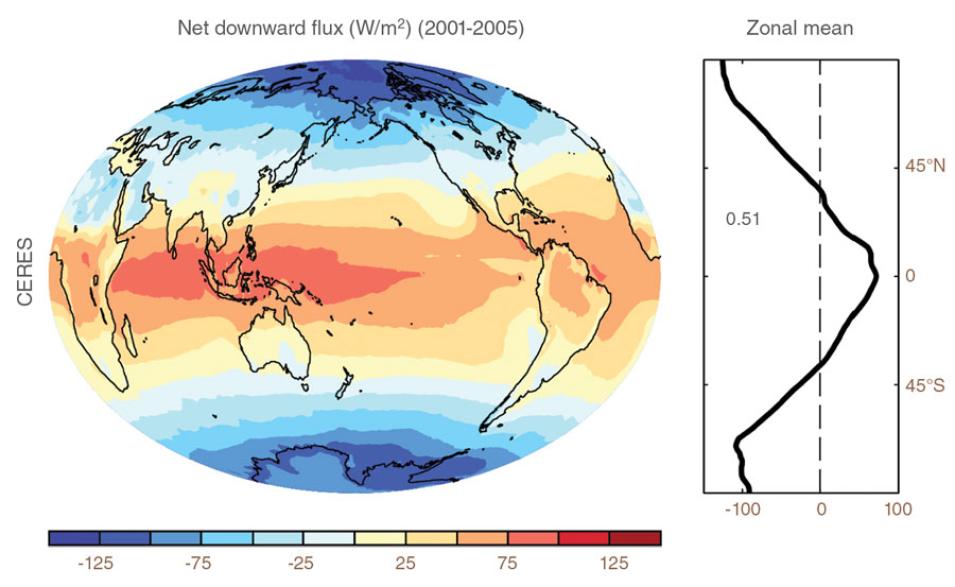
This image shows net downward radiation flux at the top of Earth’s atmosphere in watts per square meter. Blues indicate regions losing heat; oranges and reds indicate where heat is building up. Averaged over the globe for the 2001-2005 period, 0.51 watts per square meter of energy are accumulating, which is causing the planet to warm. Data are from the Clouds and Earth’s Radiant Energy System (CERES), which helps scientists understand Earth’s heat budget. (Courtesy R. P. Allan)

This radiation exchange is best measured at the top of the atmosphere, where sunlight enters Earth’s climate system, and where orbiting satellites can act like a proxy thermometer. Allan’s team used data from the Clouds and the Earth’s Radiant Energy System (CERES) satellite instrument, launched in 2000, plus data from the Earth Radiation Budget Satellite (ERBS), which extended the record back to 1984. These data, obtained from NASA's Atmospheric Science Data Center (ASDC), captured incoming and reflected sunlight and emitted infrared radiation over the recent period in which the rate of global surface warming has appeared to wane. “We found the heating rate, based on this long satellite record, hadn’t declined,” Allan said. “In fact, if anything, the heating rates have become greater in the 2000s than in the period prior to it.”

If the surface warming has slowed, then where is this extra accumulating heat going? Air, land, and water absorb and release heat at different rates, and on vastly different time scales. For instance, on a summer walk along a sunny beach, the sand and air will feel quite warm, but the ocean will not. Large bodies of water possess more thermal inertia than land or air, meaning oceans will absorb heat more slowly, and will be slower to release that heat even when land or air temperatures cool. Complicating matters, different ocean layers store and release heat at different rates. Water temperatures near the ocean surface tend to be more variable, because there is a constant heat exchange with the air circulating above. Deeper ocean layers, however, exchange heat more slowly than surface layers and release that stored heat on much longer time scales. So to find the missing heat, researchers dove into the oceans.

Answers in the ocean

image
Image Caption

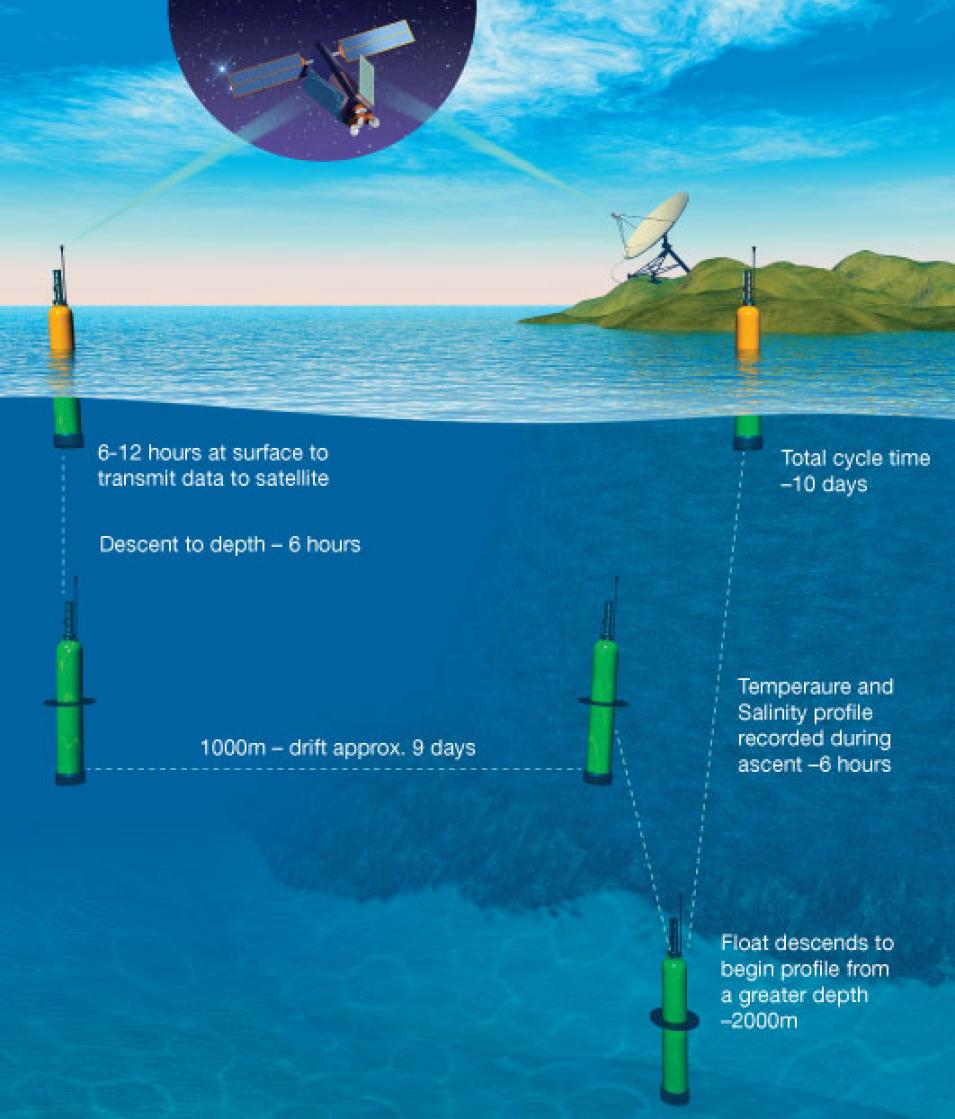
This illustration shows how Argo floats, dive, drift, and then surface to transmit ocean temperatures. (Courtesy Argo Program/Scripps Institution of Oceanography)

Scientists still measure ocean temperature by submerging instruments, but now they tap a global network of thousands of submersible floats. Deployed by the Argo project, these meter-long tubes contain temperature, salinity, and pressure sensors. They are designed to dive, drift, and then surface to relay data on ten-day cycles. The project began in 2000 with floats diving to 1,000 meters (0.62 miles), and since 2005, floats have been diving to 2,000 meters (1.24 miles). Argo floats permit researchers to observe deeper layers of the ocean that absorb heat over longer time scales. Once Allan and his colleagues had data from both the floats and the satellite instruments, they could calculate the energy imbalance.

They found that the “missing” heat had actually been continuing to build up over the satellite record and the only place it could be was lurking beneath the ocean surface. Heat not exchanged with the atmosphere at the ocean surface can eventually circulate into deeper layers. “In some decades this penetration of heat to deeper layers becomes more efficient, and simulations and observations suggest that this was the case in the 2000s,” Allan said. “This explains how you can have a slowing in the surface warming yet heat is continuing to accumulate at a greater rate.”

Ocean temperature data were critical to gauge the imbalance, but over the long term, scientists need both the Argo and satellite records. “While the ocean data are the most important in determining how much the Earth is heating up, the ERBS and CERES data can accurately track changes in this heating rate and measure the shorter term fluctuations much better than the ocean data alone,” Allan said.

Modeling the energy budget

But the scientists wondered whether simulations used to make projections of future climate change could capture the changes in Earth’s energy imbalance found in the Argo and satellite data. They compared their findings with a spectrum of climate models that simulated Earth’s recent conditions. “No one model is perfect,” said atmospheric scientist Norman Loeb, one of Allan’s colleagues. “So there’s an interest in looking at the ensemble of different climate models to get a sense of how they are performing relative to observations.”

The models are designed to simulate the slow but chaotic variations of our vast oceans. Allan said, “If you’re watching a river, you’d see all these chaotic fluctuations in the river from one moment to the next. With the ocean, things work on much slower time scales, so you get the same sorts of fluctuations, but on a decade-to-decade range.” For instance, a series of strong La Niñas since 2000 kept the ocean surface cool, which weakened the normal rate of heat loss from the ocean surface to the atmosphere above and led to more heat penetrating to deeper ocean layers.

“The models are trying to represent the true variability,” Loeb said. “They’re trying to capture the changes in El Niños and La Niñas and how they impact the energy imbalance at the top of the atmosphere.” These changes include natural variability, but also include factors that force imbalances in Earth’s climate system, such as volcanic eruptions or greenhouse gases. “For example,” said Loeb, “the biggest forcing in the record is from the Mount Pinatubo eruption.” The 1991 eruption in the Philippines injected massive amounts of ash and particles into the atmosphere, dampening global temperatures and altering Earth’s climate for several years.

Imbalance and variability

image
Image Caption

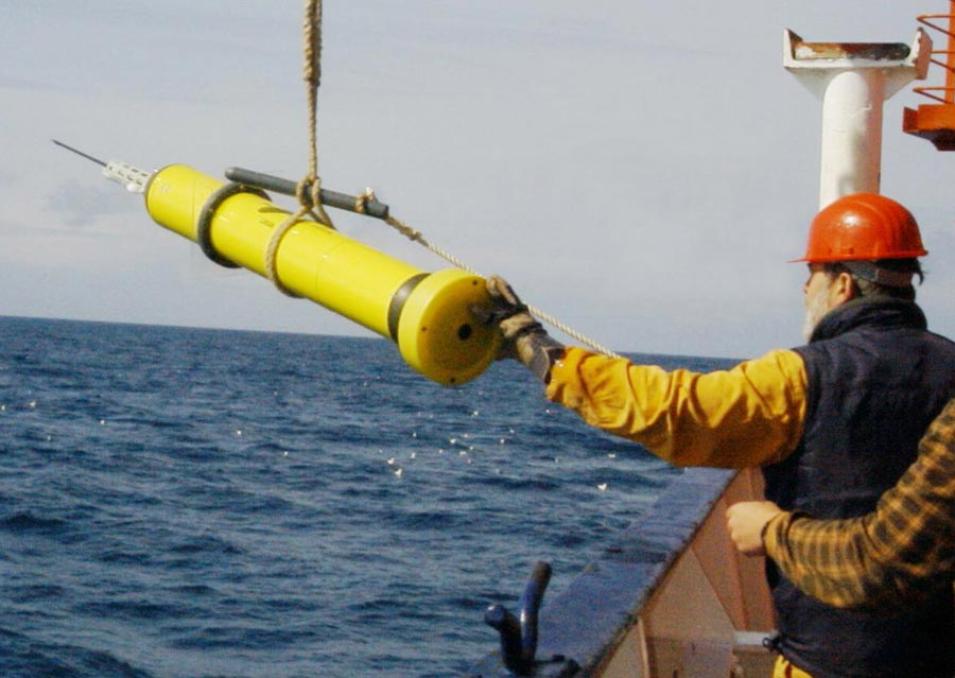
Researchers deploy an Argo float, a submersible instrument that records ocean temperatures and other data up to 2,000 meters (1.24 miles) deep. (Courtesy Argo Program)

The researchers concluded that the recent slowing in global surface warming is part of natural climate fluctuations. But the energy budget is still out of balance, which translates into heat no matter where it accumulates. Loeb said, “You could think of the oceans as causing a thermal lag on the system, and over time, the system will tend to warm up to try and restore the equilibrium. But it takes place over a long period of time because of the ocean’s ability to store heat.” Earth’s climate system perpetually tries to restore the balance, and this absorbed heat will eventually make its way back into the atmosphere.

Over the long term, additional heat leads to sea level rise. “When the oceans warm, they expand. And that raises sea level,” Allan said. “On the other hand, when land warms, and glaciers and ice sheets melt, that adds extra water to the ocean, which also raises sea level.” It takes hundreds of years for heat to penetrate to the depths of the ocean and for giant ice sheets to melt. “That’s why sea level rise is a multi-century problem,” said Allan.

Heat can travel through the oceans and influence climate differently in different parts of the world. For instance, research involving NASA indicates that heat accumulating beneath the Pacific Ocean surface may have traveled to the Indian Ocean. Scientists are still trying to understand which climate patterns are part of natural variability, and which are being changed by human activity. “We’re only actually sampling a few of the bumps and dips of decadal variations,” Allan said. “Continued tracking of Earth’s energy balance is crucial for gauging how future warming will progress as human activities continue to pump greenhouse gases into the atmosphere.” And this has major implications for the consequent impacts on human societies and the ecosystems upon which they depend.

References

Allan, R. P., C. Liu, N. G. Loeb, M. D. Palmer, M. Roberts, D. Smith, and P.-L. Vidale. 2014. Changes in global net radiative imbalance 1985-2012. Geophysical Research Letters 41: 5,588–5,597, doi:10.1002/2014GL060962.

Loeb, N. G., H. Wang, A. Cheng, S. Kato, J. T. Fasullo, K.-M. Xu, and R. P. Allan. 2015. Observational constraints on atmospheric and oceanic cross-equatorial heat transports: revisiting precipitation asymmetry problem in climate models. Climate Dynamics, doi:10.1007/s00382-015-2766-z.

NASA Atmospheric Science Data Center (ASDC). CERES Energy Balance and Filled Top of the Atmosphere (EBAF-TOA) Ed2.7, Hampton, VA, USA. http://ceres.larc.nasa.gov/products.php?product=EBAF-TOA.

NASA Atmospheric Science Data Center (ASDC). Earth Radiation Budget Satellite Wide Field-of-View (ERBS WFOV) 3.1, Hampton, VA, USA. https://eosweb.larc.nasa.gov/project/erbe/erbe_table.

For more information

NASA Atmospheric Science Data Center (ASDC)

Clouds and Earth’s Radiant Energy System (CERES)

Earth Radiation Budget Satellite Nonscanner Wide Field-of-View (ERBS WFOV) instrument

About the remote sensing data
Satellites Terra and Aqua Earth Radiation Budget Satellite (ERBS)
Sensors Clouds and the Earth's Radiant Energy System (CERES) Wide Field-of-View (WFOV) Nonscanner
Data sets CERES EBAF Ed2.7 ERBS WFOV 3.1
Resolution 1 x 1 degree 10 x 10 degree
Parameters Radiance Radiance
DAACs NASA Atmospheric Science Data Center (ASDC) NASA ASDC

Details

Last Updated

Published

Data Center/Project

Atmospheric Science Data Center (ASDC)