Nitrogen dioxide (NO2) is a gas that is considered a pollutant in large quantities. The primary sources of nitrogen dioxide on Earth are automobile exhaust, smoke from industry, and the burning of fossil fuels. It is also produced when nitric oxide (NO), another nitrogen oxide that forms during combustion, reacts with oxygen. 

NASA’s Earth-observing instruments collect data on concentrations of trace gases in the atmosphere, including nitrogen dioxide and other nitrogen oxides. These datasets are used to track historical and near real-time global and regional emissions, enabling scientists to study the effects of nitrogen oxides on human health, air quality, and weather patterns.

Get Nitrogen Dioxide Data

Access a range of datasets and data tools to further your nitrogen dioxide research.

Learn How to Use Nitrogen Dioxide Data
Access a range of webinars, tutorials, data recipes, and data stories to enhance your knowledge of Earth Observation data.
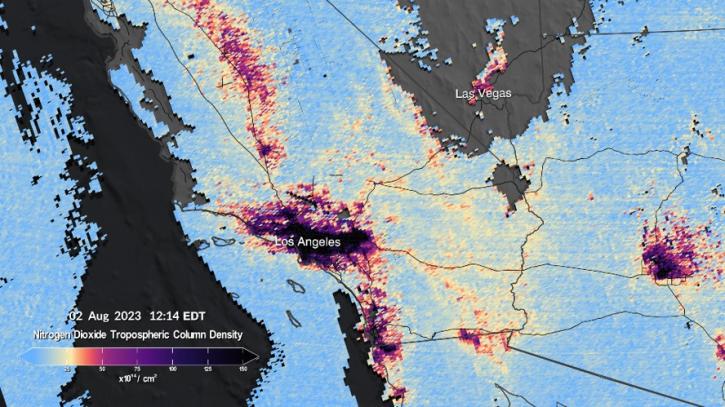
Map of TEMPO measurements of nitrogen dioxide over Southern California at 12:14 pm EDT, August 2, 2023 illustrating higher levels of nitrogen dioxide over Los Angeles
Finding Your TEMPO: An Introduction to the Mission, Products, and Data Services for Air Quality Observations over North America
This webinar provides an overview of the TEMPO mission and its data products, including nitrogen dioxide data, and shows how to discover and access TEMPO data products using NASA's Earthdata Search.
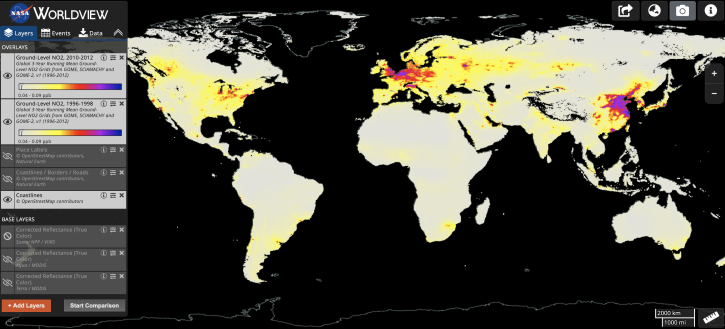
Screenshot of Worldview showing nitrogen dioxide data.
How to Find and Visualize Nitrogen Dioxide Satellite Data
Find research-quality nitrogen dioxide data to assess regional air quality and potential trends in industrial activity.
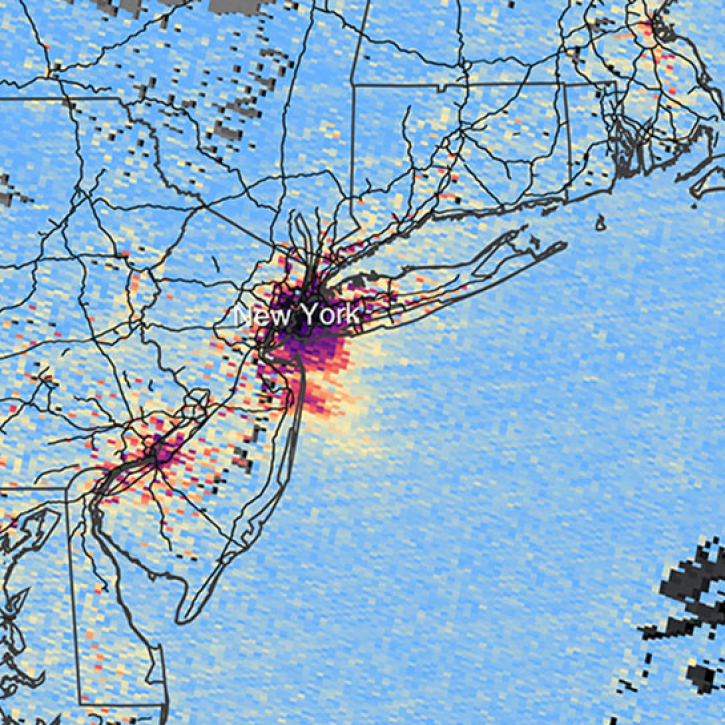
A square image showing nitrogen dioxide levels over the New York City region. Red and yellow areas indicate areas of high nitrogen dioxide concentrations.
Air Quality Data for Health-Related Applications Collection
The Air Quality Data for Health-Related Applications (AQDH) collection of air quality data can be used for health-related research and applications.
Discover and Visualize Nitrogen Dioxide Data
NASA data help us understand Earth's changing systems in more detail than ever before, and visualizations bring these data to life, making Earth science concepts accessible, beautiful, and impactful.
Data visualization is a powerful tool for analysis, trend and pattern recognition, and communication. Our resources help you find world-class data visualizations to complement and enhance your research. We also have tools and tutorials to help you translate nitrogen dioxide data into compelling visuals.
Image
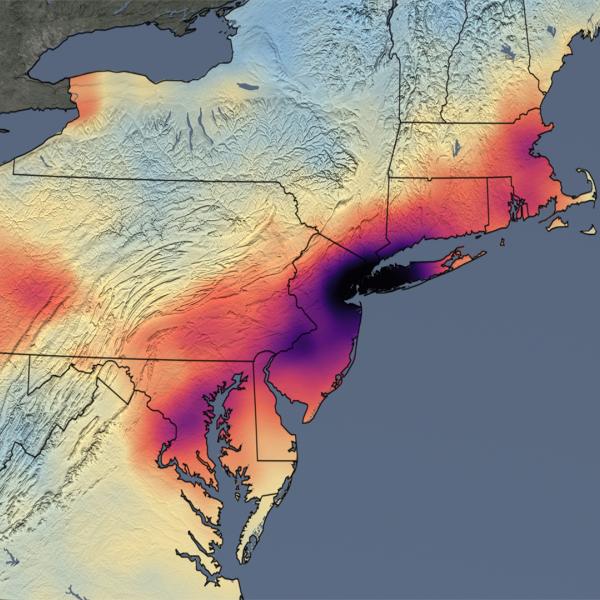
A map of the Northeastern United States with higher levels of nitrogen dioxide shown in dark red and lower levels shown in orange and yellow.
A visualization of the average levels of nitrogen dioxide in March of 2015-2019 in the Northeast U.S. using data from NASA's Ozone Monitoring Instrument (OMI). Credit: NASA's Scientific Visualization Studio.

Join Our Community of NASA Data Users

While NASA data are openly available without restriction, an Earthdata Login is required to download data and to use some tools with full functionality.

Learn About the Benefits of Earthdata Login

Frequently Asked Questions

Earthdata Forum

Our online forum provides a space for users to browse thousands of FAQs about research needs, data, and data applications. You can also submit new questions for our experts to answer.

Submit Questions to Earthdata Forumand View Expert Responses

Earthdata
Forum