Albedo is a measurement of how much a surface reflects solar energy. Snow and ice are substances with high albedo. Ice reflects 50-70% of sunlight, and snow bounces back as much as 90% of solar radiation. The more energy a surface reflects, the cooler it and it's surrounding environment will be, which is partly why Earth's poles, with its great caps of ice, are so cold and a key controller of the planet's climate and weather.

Measuring albedo is an important detail for understanding how snow and ice influence Earth's weather and climate, and for making forecasts, predicting spring flooding, and powering computer models.

NASA has albedo data generated from space-based instruments such as the Moderate Resolution Imaging Spectroradiometer (MODIS) as well as from various field campaigns and computer models.

Get Snow/Ice Albedo Data

Access a range of datasets and data tools to further your snow and ice albedo research.

Learn How to Use Snow/Ice Albedo Data

Access a range of webinars, tutorials, data recipes, and data stories to enhance your knowledge of Earth Observation data.
Headshot of Anne Nolin wearing a beanie and standing in front of a wall
Data User Story: Dr. Anne Nolin
Who uses NASA Earth science data? Dr. Anne Nolin, to study mountain ecosystems.
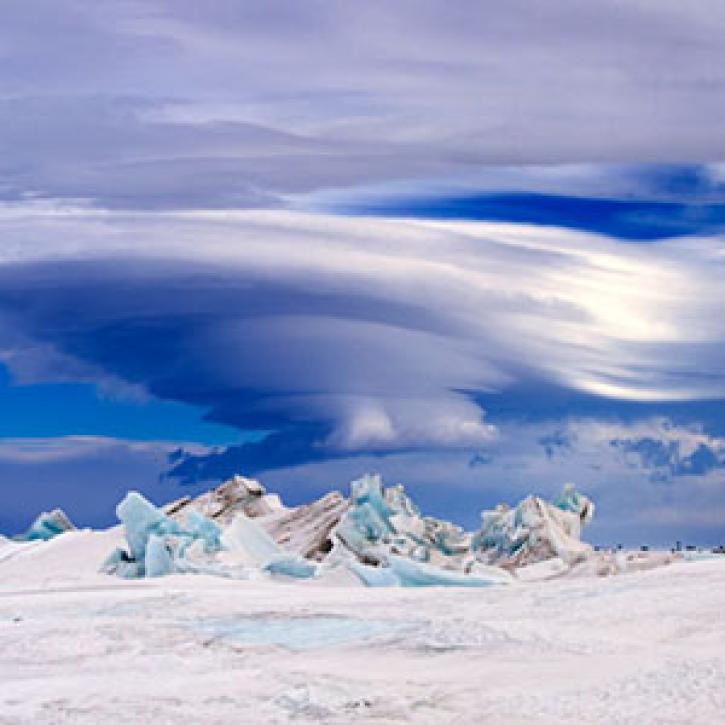
A pressure ridge forms on the sea ice near Scott Base in Antarctica.
Unexpected Ice
Sea ice in the Southern Ocean defies predictions.
Photograph of Dr. Eric Sproles
Data User Story: Dr. Eric Sproles
Water is a finite resource, and the availability of freshwater can have major social impacts. Dr. Eric Sproles uses Earth observing data as part of his studies into water’s eco-social effects.
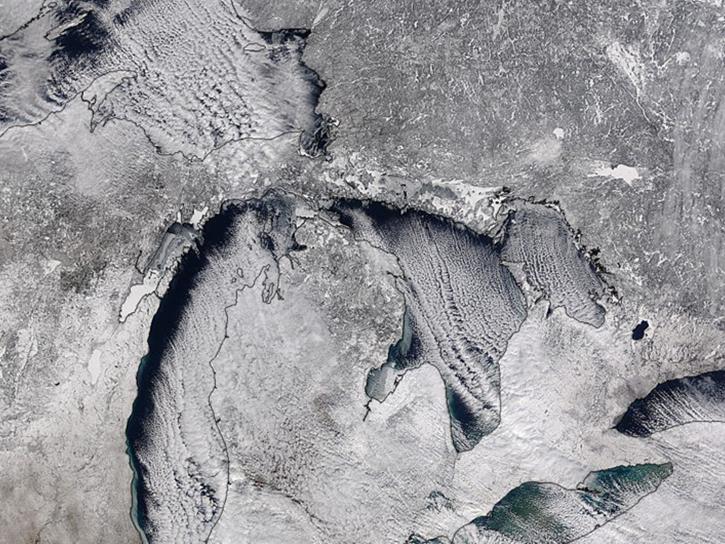
NASA LANCE Terra/MODIS true color image of cloud sheets and snow on the Great Lakes acquired on February 11, 2016
Lake Effect Snow Event during GCPEx Field Campaign
Studying the mechanics of lake effect snow helps researchers better understand water/land contrasts across snowfall bands.
Discover and Visualize Snow/Ice Albedo Data
NASA data help us understand Earth's changing systems in more detail than ever before, and visualizations bring these data to life, making Earth science concepts accessible, beautiful, and impactful.
Data visualization is a powerful tool for analysis, trend and pattern recognition, and communication. Our resources help you find world-class data visualizations to complement and enhance your research. We also have tools and tutorials to help you translate snow and ice albedo data into compelling visuals.
Image
This rectangular image shows snow cover around the Lake Superior region of North America. The base of the image is a color landscape image of the ground with clouds. Overlaid across the image are patches of yellow, orange, and red pixels to mark areas where snow is reflecting light.
This visualization is a daily composite of snow cover and albedo derived from the MODIS/Aqua Snow Cover 5-Min L2 Swath 500m dataset. Pixels in yellow represent areas with low albedo, orange is moderate albedo, and red are locations with high levels of reflectance.

Join Our Community of NASA Data Users

While NASA data are openly available without restriction, an Earthdata Login is required to download data and to use some tools with full functionality.

Learn About the Benefits of Earthdata Login

Frequently Asked Questions

Earthdata Forum

Our online forum provides a space for users to browse thousands of FAQs about research needs, data, and data applications. You can also submit new questions for our experts to answer.

Submit Questions to Earthdata Forumand View Expert Responses
Earthdata
Forum