We are in the process of migrating all NASA Earth science data sites into Earthdata from now until end of 2026. Not all NASA Earth science data and resources will appear here until then. Thank you for your patience as we make this transition.
Read about the Web Unification Project
Poverty Levels Data Access and Tools
Access a range of datasets and data tools to further your research into poverty levels including the POPGRID Viewer and SEDAC Population Estimator.
Poverty Levels Datasets
| Dataset | Version Sort ascending | Platforms | Instruments | Temporal Extent | Spatial Extent | Spatial Resolution | Data Format |
|---|---|---|---|---|---|---|---|
| U.S. Social Vulnerability Index Grids, Revision 01 | 1.01 | MODELS | Computer | 2000-01-01, 2010-01-01, 2014-01-01, 2016-01-01, 2018-01-01, 2020-01-01 |
N: 72 S: 17 E: -65 W: -180 |
0.008333 Decimal Degrees x 0.008333 Decimal Degrees | GeoTIFF, PDF, PNG |
| Poverty Mapping Project: Unsatisfied Basic Needs | 1.00 | MODELS | Computer | 1998-01-01 to 2001-12-31 |
N: 33 S: -60 E: -26 W: -119 |
CSV, Shapefile | |
| Shared Socioeconomic Pathways (SSPs) Literature Database, v1, 2014-2019 | 1.00 | MODELS | Computer | 2014-01-01 to 2019-12-31 |
N: 90 S: -90 E: 180 W: -180 |
Excel | |
| Sub-global Scenarios that Extend the Global SSP Narratives: Literature Database, Version 1, 2014-2021 | 1.00 | MODELS | Computer | 2014-01-01 to 2021-12-31 |
N: 90 S: -90 E: 180 W: -180 |
Excel | |
| U.S. Social Vulnerability Index Grids | 1.00 | MODELS | Computer | 2000-01-01, 2010-01-01, 2014-01-01, 2016-01-01, 2018-01-01 |
N: 72 S: 17 E: -65 W: -180 |
GeoTIFF, PDF, PNG | |
| Global Database of Light-based Geospatial Income Inequality (LGII) Measures, Version 1 | 1.00 | MODELS, DMSP | Computer, OLS | 1992-01-01 to 2013-12-31 |
N: 90 S: -90 E: 180 W: -180 |
Excel | |
| Global Gridded Relative Deprivation Index (GRDI), Version 1 | 1.00 | MODELS | Computer | 2010-01-01 to 2020-12-31 |
N: 82.18 S: -55.98 E: 179.82 W: -180 |
GeoTIFF, PDF, PNG | |
| Poverty Mapping Project: Global Subnational Prevalence of Child Malnutrition | 1.0 | MODELS | Computer | 1990-01-01 to 2002-12-31 |
N: 85 S: -90 E: 180 W: -180 |
ASCII Grid, Excel, Shapefile, PDF, PNG, WMS | |
| Poverty Mapping Project: Small Area Estimates of Poverty and Inequality | 1.0 | MODELS | Computer | 1990-01-01 to 2002-12-31 |
N: 90 S: -58 E: 180 W: -180 |
CSV, Shapefile, PDF, PNG | |
| Country-Level GDP and Downscaled Projections Based on the SRES A1, A2, B1, and B2 Marker Scenarios, 1990-2100 | 1.0 | MODELS | Computer | 1990-01-01 to 2100-12-31 |
N: 90 S: -90 E: 180 W: -180 |
Excel |
SHOWING 10 OF 17
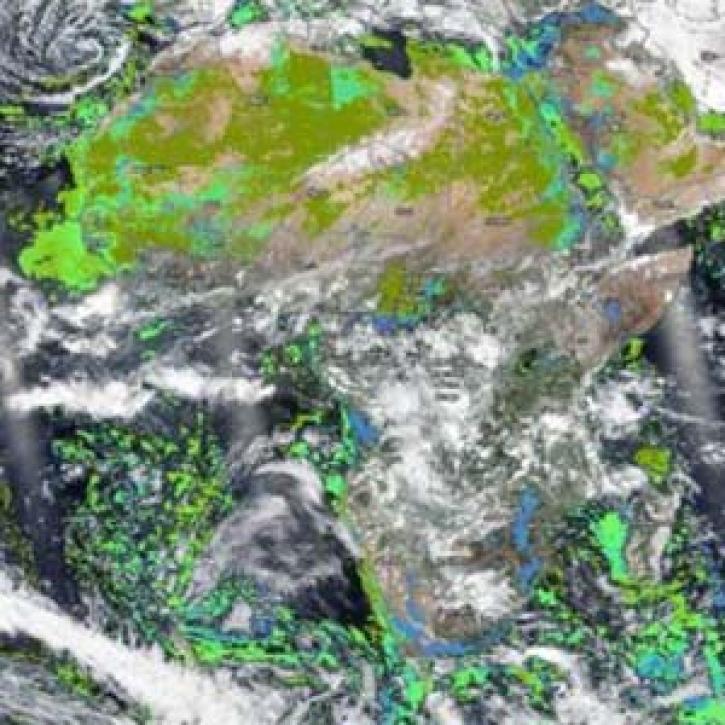
Featured Poverty Levels Observation Method: VIIRS
The Visible Infrared Imaging Radiometer Suite (VIIRS) is aboard the joint NASA/NOAA Suomi National Polar-orbiting Partnership (Suomi NPP) and NOAA-platforms. VIIRS collects visible and infrared imagery along with global observations of Earth's land, atmosphere, cryosphere, and ocean. The instrument can detect light from human settlements to measure the size and growth of those areas as well as changes to the regions as a result of power loss from storms, conflicts, and other events.
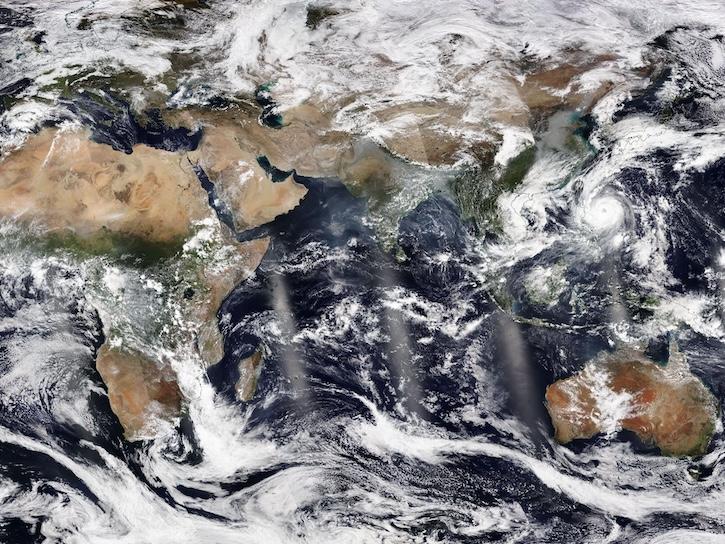
The Visible Infrared Imaging Radiometer Suite (VIIRS) will help ensure continuity of Earth observations after the upcoming retirement of the Moderate Resolution Imaging Spectroradiometer (MODIS).
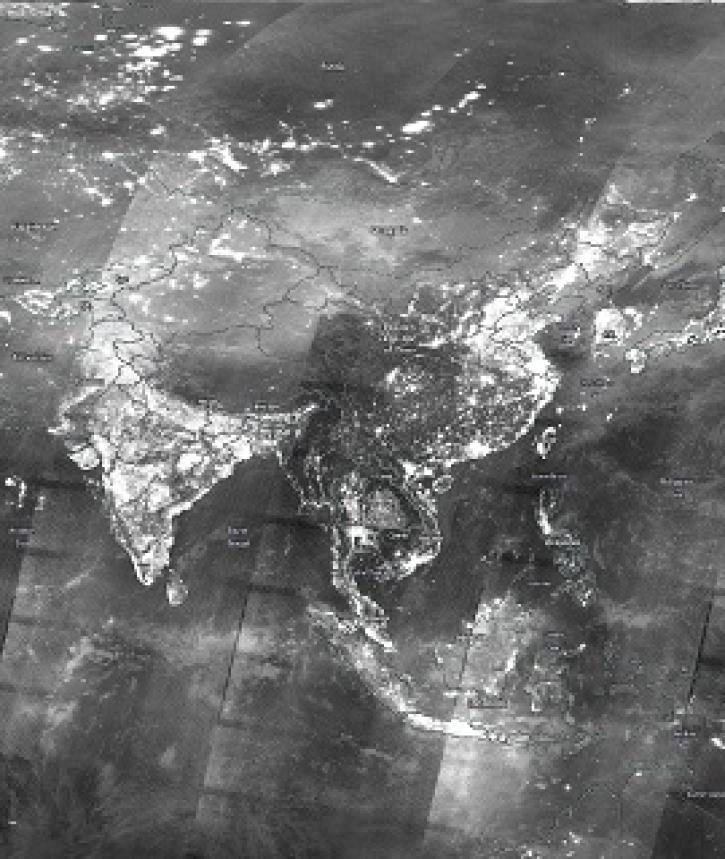
Image captured on 29 December 2019, by the VIIRS instrument, aboard the joint NASA/NOAA Suomi NPP satellite.
Two new near real-time VIIRS products are available for download in NASA’s Land, Atmosphere Near real-time Capability for EOS (LANCE) and for interactive exploration using NASA Worldview.
Frequently Asked Questions
Earthdata Forum
Our online forum provides a space for users to browse thousands of FAQs about research needs, data, and data applications. You can also submit new questions for our experts to answer.
Submit Questions to Earthdata Forumand View Expert Responses