The health and well-being of people are directly related to where in their communities they live and what they live in, how much money they make and their other available economic resources, their social descriptors such as race, the environment and climate in the area where they reside, and many other significant factors. For example, one recent NASA study found that in Miami, FL, people who are poorest and live in trailer parks are at highest risk for summertime heat-related illness. One way to track the influence of wealth and other factors on a population's health is by taking the elements into account in creating vulnerability levels and indexes datasets. Researchers can use NASA's vulnerability levels and indexes in combination with our datasets focusing on air pollution, heat exposure, flooding inundation, and other Earth science measurements to determine the level of risk people live with under various conditions.

Get Vulnerability Levels/Index Data

Access a range of datasets and data tools to further your population vulnerability levels research.

Learn How to Use Vulnerability Levels/Index Data

Access a range of webinars, tutorials, data recipes, and data stories to enhance your knowledge of Earth Observation data.
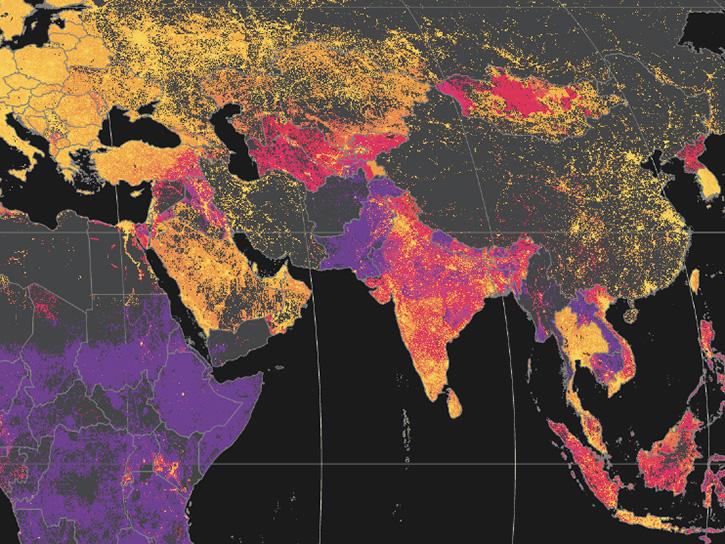
The graphic shows Global Annual PM2.5 Grids from MODIS, MISR, and SeaWIFS Aerosol Optical Depth (AOD) from 1998 to 2019.
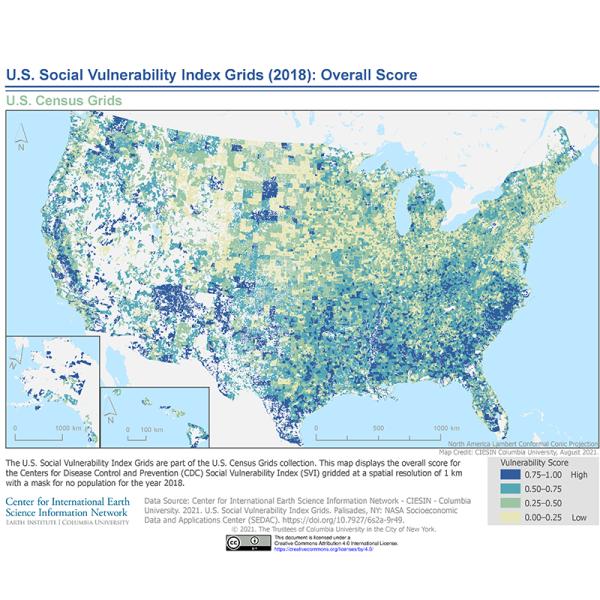
SEDAC’s New U.S. Social Vulnerability Index Grids Dataset Supports Environmental Justice and Hazard Response Applications
The recently released dataset allows users to obtain social vulnerability metrics with population estimates for any user-defined area within the US.
Global Gridded Relative Deprivation Index (GRDI) map showing the relative levels of multidimensional deprivation and poverty
An Introduction to NASA's SEDAC Datasets for Health and Air Quality
In this webinar, learn how data archived by NASA's Socioeconomic Data and Applications Center (SEDAC) brings new insight to the connections between air quality and public health.
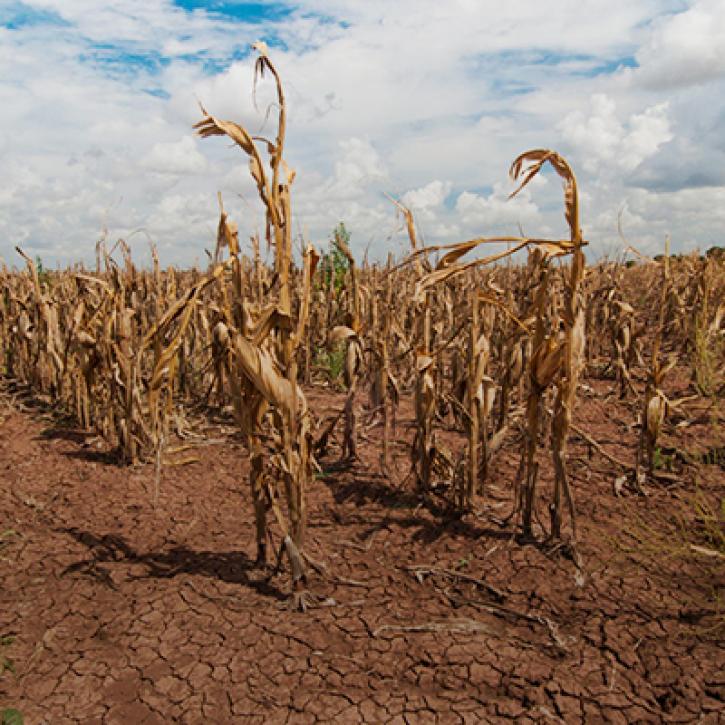
Desiccated corn stalks growing from dry cracked soil.
2017 Drought - Havoc from the Heat
The aftermath of 2017 drought sparked wildfires and compromised water resources, which led to reduced agricultural production and the destruction of property amounting to billions of dollars.
Discover and Visualize Data
NASA data help us understand Earth's changing systems in more detail than ever before, and visualizations bring these data to life, making Earth science concepts accessible, beautiful, and impactful.
Data visualization is a powerful tool for analysis, trend and pattern recognition, and communication. Our resources help you find world-class data visualizations to complement and enhance your research. We also have tools and tutorials to help you translate vulnerability levels and index data into compelling visuals.
Image
screenshot of U.S. with colors indicating social vulnerability
U.S. Social Vulnerability Index Grids, V 1.01 2020: Socioeconomic Status Score. Credit: SEDAC

Join Our Community of NASA Data Users

While NASA data are openly available without restriction, an Earthdata Login is required to download data and to use some tools with full functionality.

Learn About the Benefits of Earthdata Login

Frequently Asked Questions

Earthdata Forum

Our online forum provides a space for users to browse thousands of FAQs about research needs, data, and data applications. You can also submit new questions for our experts to answer.

Submit Questions to Earthdata Forumand View Expert Responses

Earthdata
Forum