The coastlines of Earth’s land masses are home to a variety of landscape features, such as cliffs, beaches, fjords, glaciers, dunes, and caves. Ocean tides, currents, rivers, and the wind shape coastal landscapes by eroding, depositing, or shifting material along the coastline. 

Coastal landforms support important ecosystems and often protect inland areas from flooding. However, these habitats can be placed in jeopardy due to natural disasters and human activity. 

NASA’s Earth-observing satellites collect data about the structure of the coasts and how these landforms change over time. Scientists use these data products to study coastal environments, understand the interactions between the land and the ocean, and come up with ways to improve disaster preparedness.

Get Coastal Landform Data

Access a range of datasets and data tools to further your research into coastal landforms.

Learn How to Use Coastal Landforms Data
Access a range of webinars, tutorials, data recipes, and data stories to enhance your knowledge of Earth Observation data.
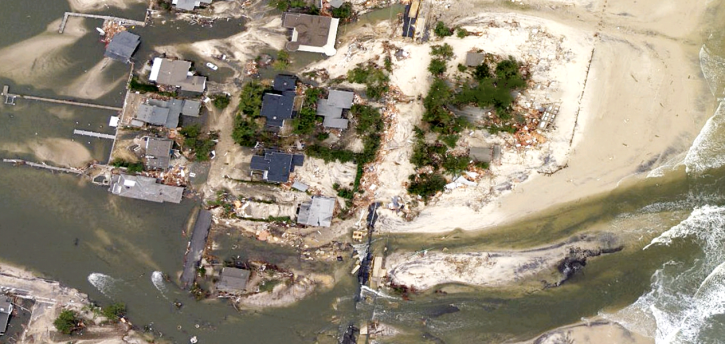
This is an aerial view of coastal flooding in Mantolokig, NJ. This rectangular image shows sandy land, trees, roads, houses, and other structures washed out by flooding water.
UNBOUND for Coastal Issues Data Workshop Report Released
This Understanding Needs to Broaden Outside Use of NASA Data (UNBOUND) workshop connected coastal zone groups with key NASA data.
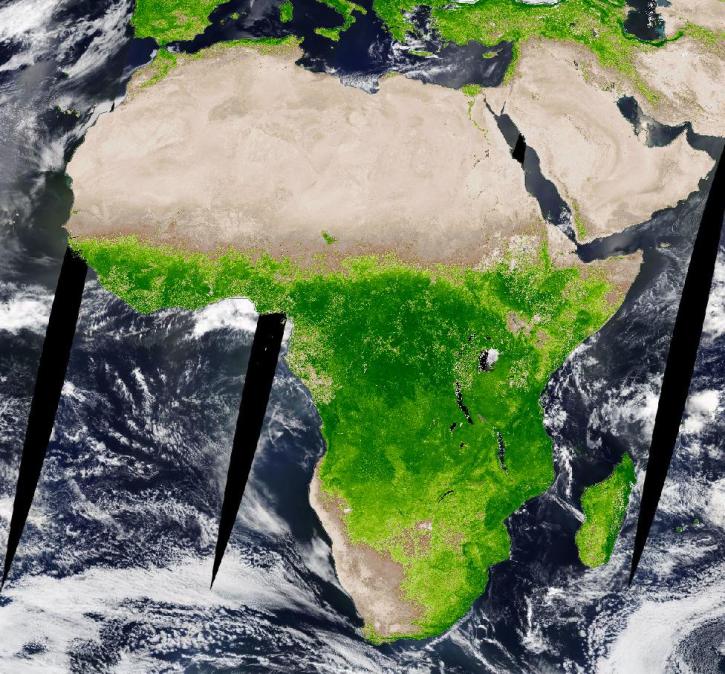
Image of Africa and the Middle East. Lower half of Africa is bright green, indicating healthy vegetation. The northern quarter of Africa and the Middle East is brown, indicating sparse or unhealthy/stressed vegetation.
Data User Spotlight: Dr. David Lagomasino
Coastal ecosystems are some of Earth’s most biologically varied environments, especially coastal mangrove forests. Dr. Lagomasino uses Earth observing data to study these vital biomes.
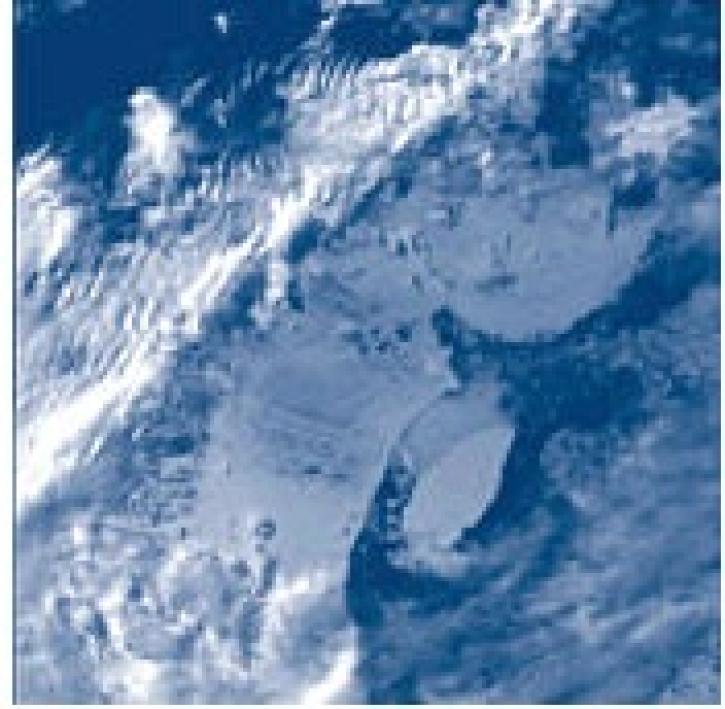
Larsen B Ice Shelf West Antarctic Peninsula
Disintegration of the Ninnis Glacier Tongue
An analysis of satellite imagery showed that a large glacier tongue on the coast of East Antarctica disintegrated, changing the shape of the coastline almost overnight.
Discover and Visualize Coastal Landform Data
NASA data help us understand Earth's changing systems in more detail than ever before, and visualizations bring these data to life, making Earth science concepts accessible, beautiful, and impactful.
Data visualization is a powerful tool for analysis, trend and pattern recognition, and communication. Our resources help you find world-class data visualizations to complement and enhance your research. We also have tools and tutorials to help you translate coastal landform data into compelling visuals.
Image
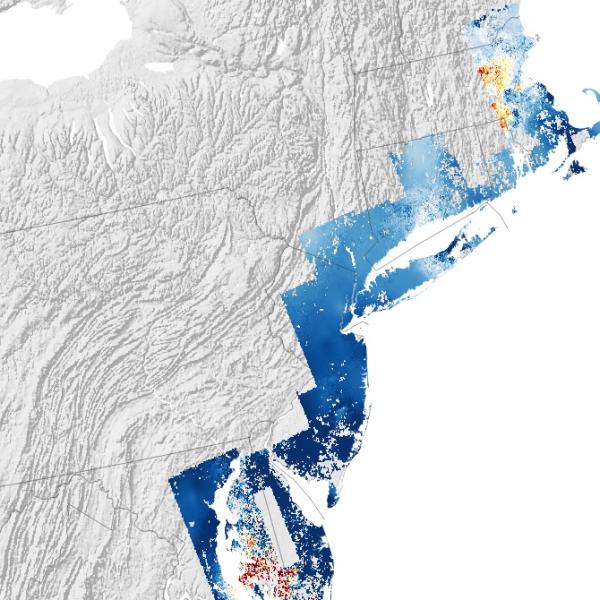
A map of the East Coast with elevation data shown in varying shades of blue and orange.
This map highlights the variability in the rising and falling of land—or vertical land motion—across much of the East Coast. Areas shown in blue subsided between 2007 and 2020, with darker blue areas sinking the fastest. The areas shown in dark red rose the fastest. Credit: NASA Earth Observatory.

Join Our Community of NASA Data Users

While NASA data are openly available without restriction, an Earthdata Login is required to download data and to use some tools with full functionality.

Learn About the Benefits of Earthdata Login

Frequently Asked Questions

Earthdata Forum

Our online forum provides a space for users to browse thousands of FAQs about research needs, data, and data applications. You can also submit new questions for our experts to answer.

Submit Questions to Earthdata Forumand View Expert Responses

Earthdata
Forum