Access a range of datasets and data tools to further your erosion and sedimentation research.
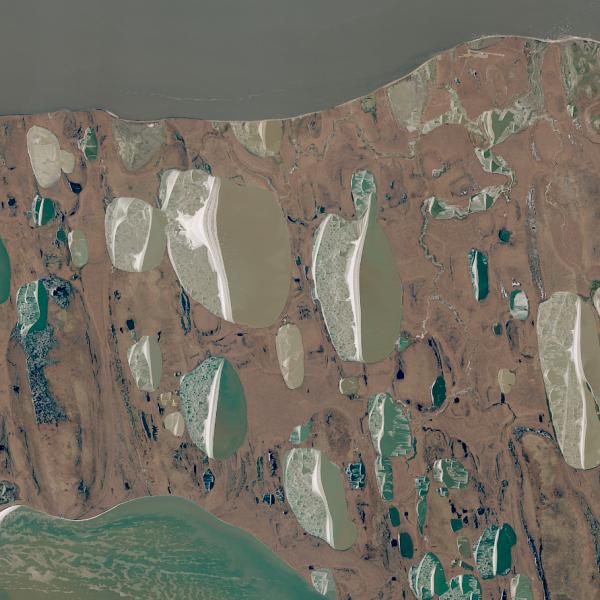
Earth’s weather and water cycles mean that the planet’s land surface is constantly changing. When water or wind flows across a landform, soil and rock break down via the process of erosion. When particles of material are suspended in water, they can be carried across large distances before settling into landforms in a process known as sedimentation.
Sometimes, the effects of erosion and sedimentation can be positive, with sediment flows transporting nutrients that benefit agriculture. However, excess erosion or sedimentation can also strip nutrients from soil, clog waterways, and disrupt ecosystems. Human activities such as deforestation and urban development can loosen sediment and increase the likelihood of sediment transportation.
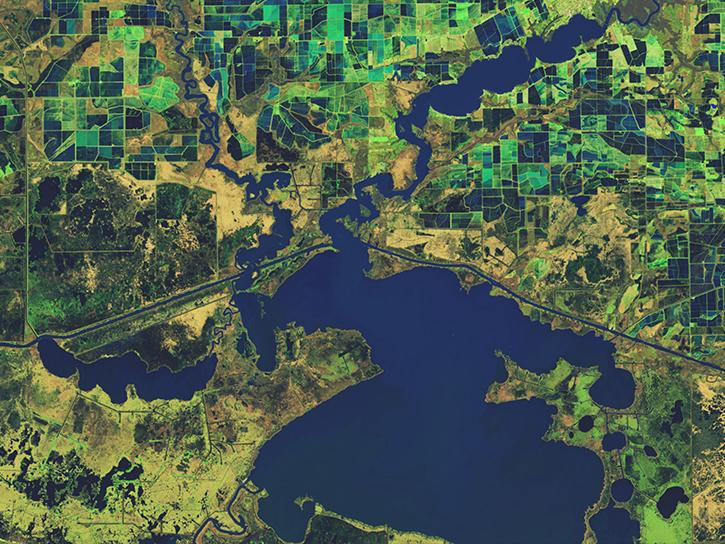
NASA’s Earth-observing satellites capture sediment plumes, track weather events that can fuel erosion and sedimentation processes, and help create topographic maps of how land shifts over time. These data help researchers find solutions for improved agriculture production, ecosystem management, and flood prevention.
Learn How to Use Erosion/Sedimentation Data

Join Our Community of NASA Data Users
While NASA data are openly available without restriction, an Earthdata Login is required to download data and to use some tools with full functionality.
Learn About the Benefits of Earthdata LoginFrequently Asked Questions
Earthdata Forum
Our online forum provides a space for users to browse thousands of FAQs about research needs, data, and data applications. You can also submit new questions for our experts to answer.
Submit Questions to Earthdata Forumand View Expert Responses
