
What is salinity?

Salinity is defined as the amount of dissolved salt in a body of water: 1 gram of salt per 1000 grams of water is defined as 1 practical salinity unity (PSU). The salinity range of the ocean is generally about 32 to 37 PSU. 

Salinity throughout the ocean is influenced by precipitation and evaporation, river runoff, and ice melt. These patterns influence the global water cycle, nutrient cycling, ocean currents, and the health and distribution of marine ecosystems. 

How do we measure salinity?

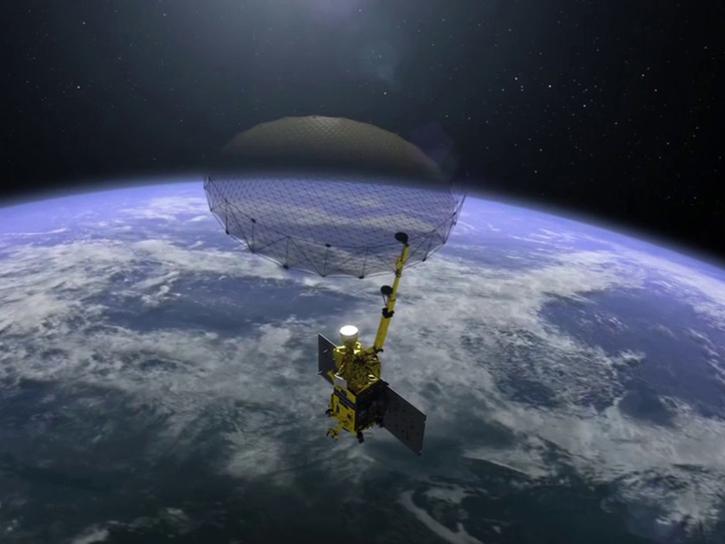
NASA missions like Soil Moisture Active Passive (SMAP) provide a global picture of ocean salinity, detecting tiny variations in the return of radio waves to satellites in order to assess the salt content in seawater. The Suomi National Polar-orbiting Partnership (Suomi NPP) also measures ocean salinity using multispectral infrared sensors. 

While both of these sensors can only observe the ocean surface, the data they provide supports models like Estimating the Circulation and Climate of the Ocean (ECCO), a global model of ocean circulation supported by decades of remote sensing and in situ measurements. Models like ECCO help researchers examine trends in ocean temperature and salinity, and project how these might change in the decades to come. 

What can we do with salinity data? 

Understanding salinity is crucial to our understanding of the ocean as a whole. It shapes the patterns of circulation and vertical overturning that influence weather around the globe. It also illuminates the effects of sea level rise and polar ice melt on ocean conditions, and the impacts they may have on marine ecosystems. 

Get Salinity Data

Access a range of datasets and data tools to further your salinity research.

Learn How to Use Salinity Data

Access a range of webinars, tutorials, data recipes, and data stories to enhance your knowledge of Earth observation data.
river plume from the Amazon River
Satellite Sea Surface Salinity to Monitor River Plumes Impacts
Ocean researchers are studying the data consistency between different salinity products.
Black Marble HD 2016 annual composite over Los Angeles, CA generated using the NASA VIIRS DNB algorithm. Click on image to see larger version.
An Introduction to Suomi NPP NASA VIIRS Data Products
Learn how to access and use VIIRS/Suomi-NPP data products.
sea surface salinity visualization map
Using Coastal Surface Salinity to Monitor Global Water Cycle Changes
Research shows that coastal sea surface temperatures could be used as a proxy for detecting changes that are expected in the cycling of water between the oceans and continents.
image of SMAP satellite
16 New SMAP Products Now Available
GIBS now has Soil Moisture Active Passive (SMAP) layers available for soil moisture and temperature, snow mass, heterotrophic respiration, and more.
Discover and Visualize Salinity Data
NASA data help us understand Earth's changing systems in more detail than ever before, and visualizations help make Earth science concepts accessible, beautiful, and impactful.
Data visualization is a powerful tool for analysis, trend and pattern recognition, and communication. Our resources help you find data visualizations to complement and enhance your research. We also have tools and tutorials to help you translate salinity data into compelling visuals.
Image
This image displays the entire Earth as an oval. The ocean is shaded in patches of purple to red to show lower to higher levels of sea surface salinity. The middle portions of the globe are largely green to indicate moderate salinity.
NASA's Soil Moisture Active Passive (SMAP) mission has collected sea surface salinity data since 2015. This global Mollweide projection of SMAP data shows a range of salinities using the practical salinity scale (psu). In this map, reds show higher salinity (38 psu) and purples show relatively lower salinity (33 psu).

Join Our Community of NASA Data Users

While NASA data are openly available without restriction, an Earthdata Login is required to download data and to use some tools with full functionality.

Learn About the Benefits of Earthdata Login

Frequently Asked Questions

Earthdata Forum

Our online forum provides a space for users to browse thousands of FAQs about research needs, data, and data applications. You can also submit new questions for our experts to answer.

Submit Questions to Earthdata Forumand View Expert Responses

Earthdata
Forum