Top-of-atmosphere outgoing longwave radiative flux anomaly for December-February 1982-83. Cooler colors in this image indicate lower values of the longwave radiative flux than normal, and hence more and higher clouds. Warmer colors indicate fewer clouds than average.
Topography and fraction of area covered by sea ice, snow, and (middle) clouds for October 31, 2016. The Arctic is a semi-enclosed ocean, almost completely surrounded by land.
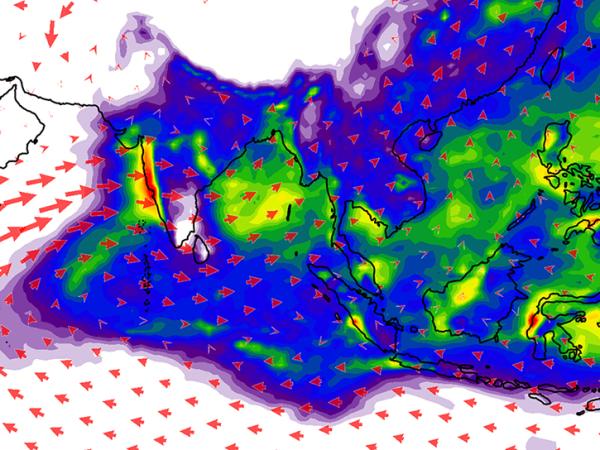
Convective precipitation and 850 hPa (hectopascal) winds for July 2010. Warmer colors indicate more convective precipitation associated with the south Asian monsoon wet season. The size of the arrows indicates stronger winds. The windfield highlights the low-level Somali jet, which pushes moist air towards southwestern India.

MERRA-2

Modern-Era Retrospective analysis for Resarch and Applications, version 2

The Modern-Era Retrospective analysis for Research and Applications, version 2 (MERRA-2) is a NASA atmospheric reanalysis of the modern satellite era produced by NASA’s Global Modeling and Assimilation Office (GMAO), distributed by Goddard Earth Sciences Data and Information Services Center (GES DISC). MERRA-2 covers the period from 1980 to the present, with a latency of approximately three weeks after the end of the previous month.

Data Centers

GES DISC

MERRA-2 replaces MERRA reanalysis using an upgraded version of the Goddard Earth Observing System Model, Version 5 (GEOS-5, version 5.12.4) data assimilation system. The advances made in the assimilation system enable the assimilation of modern hyperspectral radiance, microwave observations, and aerosol observations, along with GPS-Radio Occultation datasets. It also adds NASA's ozone profile observations that began in late 2004.

MERRA-2 is the first long-term global reanalysis to assimilate space-based observations of aerosols and represent their interactions with other physical processes in the climate system. MERRA-2 includes new variables representing ice sheets over Greenland and Antarctica. Recently, the MERRA-2 science team has generated two value-added climate products: a) the monthly climate statistics, b) monthly surface PM2.5 at the country level.

Read about the algorithmic basis of The Modern-Era Retrospective Analysis for Research and Applications, Version 2 (MERRA-2) in the Journal of Climate.

Document TypeDocument LinkDescription
Data LatencyMERRA-2 Data Latency MERRA-2 data are available from January 1980 to the present (data are usually available approximately three weeks of the following month).

File Specification


MERRA-2 Data File Specification Overview of the MERRA-2 system, including algorithms and variable list of each data collection. The file specification of MERRA (version-1) is available
MERRA-2 Climate Statistics Product File SpecificationOverview of algorithms of the MERRA-2 climate statistics product, and variable list of the data collections. This is a dataset derived from MERRA-2.
MERRA-2 Monthly Surface PM2.5 at Country Level File SpecificationOverview of algorithms of the MERRA-2 monthly surface PM2.5 at the country level. This is a dataset derived from MERRA-2.
Science DocumentationMERRA-2 Science DocumentationDocumentation about the MERRA (version 2) system and the GMAO Technical Memoranda to document and evaluate various aspects of the MERRA-2 system.
Readme DocumentsMERRA-2 ReadmeThis document lists the dataset DOI, the variable name of each data collection, data services, and examples to read the data.
MERRA-2 Climate Statistics Product ReadmeThis document lists the dataset DOI, data services, and examples to read the data.
MERRA-2 Monthly Surface PM2.5 at Country LevelThis document lists the dataset DOI, data services, and examples to read the data.
Data and Service Change LogRecords of MERRA-2 Data Reprocessing and Service ChangesList of records about data reprocessing, new data releases, and data service changes.

Basic steps to find and download data:

  1. All users are required to register to the NASA Earthdata system and link to GES DISC services. New users, please read the registration instructions as well as additional required steps when accessing the data via using tools, such as wget for windows or mac, python, Matlab, and IDV.
  2. Read the MERRA-2 File Specification carefully and search for any variables of interest to determine which data collection name that contains that variable (e.g., M2TMNXSLV for the air temperature at 2-meters).
  3. If you have found the variables of interest are in multiple data collections, please first read the definitions of these collections (e.g., instantaneous or time-averaged), and search possible explanations in the Science FAQ or Data Access FAQ to decide which collection best suits your needs.
  4. Search the data collection name using the GES DISC search system, or click on a data collection name in the following 'MERRA-2 Products' section below to go to the Product Landing Page.
  5. Use the data access methods listed on the Product Landing Page. To determine the best data service for your needs please see the descriptions of the data service functions below. Examples of how to use the data services can be found in Data Access FAQs and Data How-tos

MERRA-2 data downloading services:

Service NameDescription of Functions
Online ArchiveHTTPS service for Download the original data files.
Subset/Get Data

The interface contains multiple data-downloading functions:

  • Download Method=>Get Original Files: to download the unmodified original files.
  • Download Method=> Get File Subsets using OPeNDAP: to download geospatially subsetted regions and selected variables in netCDF or ASCII format.
  • Download Method=>Get File Subsets using the GES DISC Subsetter: to download geospatially subsetted regions and selected variables, selection of time of day and/or vertical levels. This option also offers regridding of the horizontal resolution, as well as computing daily statistics (mean, minimum, maximum) on-the-fly. The resultant data are in netCDF format.
Web Services
  • Web Services => OPENDAP: to download subsetted data or access the data remotely via data tools or customized scripts (e.g. Panoply, IDV, Python, etc.).
  • Web Services => GDS: to access the data remotely using GrADS or scripts (e.g. Python).
  • Web Services => THREDDS Data: to download time series at a given location or over a region; or remotely access time series with data tools or scripts (Panoply, ArcGIS, Python, etc.).
Service NameDescription of Functions
Giovanni

To visualize data online without downloading data. Giovanni is capable of over 20 plotting functions.

All MERRA-2 monthly mean data plus selected sub-daily variables are available in Giovanni.

Web Services

Web Services => THREDDS Data => Godiva2 (Browser-based): To visualize data without downloading data. There are three plot functions: lon-lat map, animation, and time series at a grid point..

This service is available to view all MERRA-2 data.

NASA GMAO online Visualization 


Constant 

Product GroupsDescriptionData Collection
ConstantsConstant Model Parameters

M2C0NXASM 

(const_2d_asm_Nx)

Constant Model Parameters for Usage by CTM

M2C0NXCTM 

(const_2d_ctm_Nx)

Constant Land‐Surface Diagnostics Parameters

M2C0NXLND

(const_2d_lnd_Nx)


Sub-Daily and Monthly

(Daily mean can be calculated via the GES DISC Subsetter service.) 

Product GroupsDescription

Sub-daily

Data Collection 

Monthly mean 

Data Collection 

Monthly diurnal mean 

Data Collection

Instantaneous 2-dimensionalAssimilation, Single‐Level Diagnostics

M2I1NXASM 

(inst1_2d_asm_Nx)

M2IMNXASM 

(instM_2d_asm_Nx)

M2IUNXASM 

(instU_2d_asm_Nx)

Assimilation, Vertically Integrated Diagnostics

M2I1NXINT

(inst1_2d_int_Nx)

M2IMNXINT

(instM_2d_int_Nx)

M2IUNXINT

(instU_2d_int_Nx)

Assimilation, Land Surface Forcing

M2I1NXLFO

(inst1_2d_lfo_Nx)

M2IMNXLFO

(instM_2d_lfo_Nx)

M2IUNXLFO

(instU_2d_lfo_Nx)

Assimilation, Aerosol Optical Depth Analysis

M2I3NXGAS

(inst3_2d_gas_Nx)

M2IMNXGAS

(instM_2d_gas_Nx)

M2IUNXGAS

(instU_2d_gas_Nx)

Instantaneous 3-dimensionalAssimilation, Aerosol Mixing Ratio at 72 Model Levels

M2I3NVAER

(inst3_3d_aer_Nv)

  
Assimilation, Carbon Monoxide and Ozone Mixing Ratio at 72 Model Levels

M2I3NVCHM

(inst3_3d_chm_Nv)

  
Assimilation, Aerosol Mixing Ratio Analysis Increments at 72 Model Levels

M2I3NVGAS

(inst3_3d_gas_Nv)

  
Assimilation, Assimilated Meteorological Fields at 42 Pressure Levels

M2I3NPASM

(inst3_3d_asm_Np)

M2IMNPASM

(instM_3d_asm_Np)

M2IUNPASM

(instU_3d_asm_Np)

Assimilation, Assimilated Meteorological Fields at 72 Model Levels

M2I3NVASM

(inst3_3d_asm_Nv)

  
Analysis, Analyzed Meteorological Fields at 42 Pressure Levels

M2I6NPANA

(inst6_3d_ana_Np)

M2IMNPANA

(instM_3d_ana_Np)

M2IUNPANA

(instU_3d_ana_Np)

Analysis, Analyzed Meteorological Fields at 72 Model Levels

M2I6NVANA

(inst6_3d_ana_Nv)


Time-averaged 2-dimensional


Assimilation, Aggregated Statistics, Single‐Level Diagnostics

M2SDNXSLV

(statD_2d_slv_Nx)

M2SMNXSLV

(statM_2d_slv_Nx)

 
Assimilation, Single‐Level Diagnostics

M2T1NXSLV

(tavg1_2d_slv_Nx)

M2TMNXSLV

(tavgM_2d_slv_Nx)

M2TUNXSLV

(tavgU_2d_slv_Nx)

Assimilation, Aerosol Diagnostics (extended)

M2T1NXADG

(tavg1_2d_adg_Nx)

M2TMNXADG

(tavgM_2d_adg_Nx)

M2TUNXADG

(tavgU_2d_adg_Nx)

Assimilation, Aerosol Diagnostics

M2T1NXAER

(tavg1_2d_aer_Nx)

M2TMNXAER

(tavgM_2d_aer_Nx)

M2TUNXAER

(tavgU_2d_aer_Nx)

Assimilation, Carbon Monoxide and Ozone Diagnostics

M2T1NXCHM

(tavg1_2d_chm_Nx)

M2TMNXCHM

(tavgM_2d_chm_Nx)

M2TUNXCHM

(tavgU_2d_chm_Nx)

Assimilation, COSP Satellite Simulator

M2T1NXCSP

(tavg1_2d_csp_Nx)

M2TMNXCSP

(tavg1_2d_csp_Nx)

M2TUNXCSP

(tavg1_2d_csp_Nx)

Assimilation, Surface Flux Diagnostics

M2T1NXFLX

(tavg1_2d_flx_Nx)

M2TMNXFLX

(tavgM_2d_flx_Nx)

M2TUNXFLX

(tavgU_2d_flx_Nx)

Assimilation, Vertically Integrated Diagnostics

M2T1NXINT

(tavg1_2d_int_Nx)

M2TMNXINT

(tavgM_2d_int_Nx)

M2TUNXINT

(tavgU_2d_int_Nx)

Assimilation, Land Surface Forcing

M2T1NXLFO

(tavg1_2d_lfo_Nx)

M2TMNXLFO

(tavgM_2d_lfo_Nx)

M2TUNXLFO

(tavgU_2d_lfo_Nx)

Assimilation, Land Surface Diagnostics

M2T1NXLND 

(tavg1_2d_lnd_Nx)

M2TMNXLND

(tavgM_2d_lnd_Nx)

M2TUNXLND 

(tavgU_2d_lnd_Nx)

Assimilation, Ocean Surface Diagnostics

M2T1NXOCN

(tavg1_2d_ocn_Nx)

M2TMNXOCN

(tavgM_2d_ocn_Nx)

M2TUNXOCN

(tavgU_2d_ocn_Nx)

Assimilation, Radiation Diagnostics

M2T1NXRAD

(tavg1_2d_rad_Nx)

M2TMNXRAD

(tavgM_2d_rad_Nx)

M2TUNXRAD

(tavgU_2d_rad_Nx)

Assimilation, Land Ice Surface Diagnostics

M2T3NXGLC

(tavg3_2d_glc_Nx)

M2TMNXGLC

(tavgM_2d_glc_Nx)

M2TUNXGLC

(tavgU_2d_glc_Nx)

Time-averaged 3-dimensionalAssimilated Meteorological Fields at 72 Model Levels

M2T3NVASM

(tavg3_3d_asm_Nv)

  
Assimilation, Cloud Diagnostics at 42 Pressure Levels

M2T3NPCLD

(tavg3_3d_cld_Np)

M2TMNPCLD

(tavgM_3d_cld_Np)

M2TUNPCLD

(tavgU_3d_cld_Np)

Assimilation, Cloud Diagnostics at 72 Model Levels

M2T3NVCLD

(tavg3_3d_cld_Nv)

  
Assimilation, Moist Processes Diagnostics at 73 Model Level Edges

M2T3NEMST

(tavg3_3d_mst_Ne)

  
Assimilation, Moist Processes Diagnostics at 72 Model Levels

M2T3NVMST

(tavg3_3d_mst_Nv)

  
Assimilation, Moist Processes Diagnostics at 42 Pressure Levels

M2T3NPMST

(tavg3_3d_mst_Np)

M2TMNPMST

(tavgM_3d_mst_Np)

M2TUNPMST

(tavgU_3d_mst_Np)

Assimilation, Radiation Diagnostics at 72 Model Levels

M2T3NVRAD

(tavg3_3d_rad_Nv)

  
Assimilation, Radiation Diagnostics at 42 Pressure Levels

M2T3NPRAD

(tavg3_3d_rad_Np)

M2TMNPRAD

(tavgM_3d_rad_Np)

M2TUNPRAD

(tavgU_3d_rad_Np)

Assimilation, Turbulence Diagnostics at 73 Model Level Edges

M2T3NETRB

(tavg3_3d_mst_Ne)

  
Assimilation, Turbulence Diagnostics at 42 Pressure Levels

M2T3NPTRB

(tavg3_3d_trb_Np)

M2TMNPTRB

(tavgM_3d_trb_Np)

M2TUNPTRB

(tavgU_3d_trb_Np)

Assimilation, Vertical Coordinates at 73 Model Level Edges

M2T3NENAV

(tavg3_3d_nav_Ne)

  
Assimilation, Ozone Tendencies at 42 Pressure Levels

M2T3NPODT

(tavg3_3d_odt_Np)

M2TMNPODT

(tavgM_3d_odt_Np)

M2TUNPODT

(tavgU_3d_odt_Np)

Assimilation, Moist Tendencies at 42 Pressure Levels

M2T3NPQDT

(tavg3_3d_qdt_Np)

M2TMNPQDT

(tavgM_3d_qdt_Np)

M2TUNPQDT

(tavgU_3d_qdt_Np)

Assimilation, Temperature Tendencies at 42 Pressure Levels

M2T3NPTDT

(tavg3_3d_tdt_Np)

M2TMNPTDT

(tavgM_3d_tdt_Np)

M2TUNPTDT

(tavgU_3d_tdt_Np)

Assimilation, Wind Tendencies at 42 Pressure Levels

M2T3NPUDT

(tavg3_3d_udt_Np)

M2TMNPUDT

(tavgM_3d_udt_Np)

M2TUNPUDT

(tavgU_3d_udt_Np)

MERRA-2 Derived Products

Product GroupsDescriptionData Collection

Monthly

Extreme Indices Products

Single Level, Monthly Extremes Detection Indices

M2SMNXEDI_2

M2SMNXEDI_1

(statM_2d_edi_Nx)

Single Level, Monthly Percentiles 

M2SMNXPCT_2

M2SMNXPCT_1

(statM_2d_pct_Nx)

Long-term Mean

V2(1991-2020)

V1(1981-2010)

Single Level, Long Term Mean 2-Dimensional Diagnostics

M2TCNXLTM_2

M2TCNXLTM_1

(tavgC_2d_ltm_Nx)

Long Term Mean 3-Dimensional Meteorological Fields at 12 Pressure Levels

M2TCNPLTM_2

M2TCNPLTM_1

(tavgC_3d_ltm_Np)

Monthly Surface PM2.5 

at Country Level 

Single-Level, Country-Level Surface PM2.5 Monthly Mean ProductsM2_TMAX_PM25_1

We strongly recommend users cite the MERRA-2 dataset with the Dataset DOI in their publications to indicate which data collections were used in their research.

The Dataset DOI and notation of “Data Citation” of a MERRA-2 data collection can be found on the dataset landing page (Click M2T1NXSLV_5.12.4 for the example) under the tab "Data Citation"

Template to cite MERRA-2 data with the dataset DOI:

Global Modeling and Assimilation Office (GMAO) (2015), {MERRA-2 data collection title}, Greenbelt, MD, USA, Goddard Earth Sciences Data and Information Services Center (GES DISC), Accessed: [Data Access Date], {Dataset DOI}

For example, M2T1NXSLV_5.12.4:

Global Modeling and Assimilation Office (GMAO) (2015), MERRA-2 tavg1_2d_slv_Nx: 2d,1-Hourly,Time-Averaged,Single-Level,Assimilation,Single-Level Diagnostics V5.12.4, Greenbelt, MD, USA, Goddard Earth Sciences Data and Information Services Center (GES DISC), Accessed: [Data Access Date]. 10.5067/VJAFPLI1CSIV 

To accommodate EOSDIS toolkit requirements, all MERRA files are associated with a nine-character Earth Science Data Types (ESDT). The ESDT is a short (and rather cryptic) handle for users to access sets of files. In MERRA the ESDT will be used to identify the mainstream collections and consists of a compressed version of the collection name of the form:

      M2TFHVGGG (M2 + T + F + HV + GGG)

Where

M2 = MERRA-2

T: Time Description:

   I = Instantaneous: consists of the data field on the hour starting 00:00 UTC. For hourly data, for example, the times are 00:00, 01:00, 02:00, … , 23:00 UTC. The monthly means of instantaneous diagnostics are computed from the corresponding sub-daily data.

   T = Time-averaged: consists of a continuous sequence of data averaged over the indicated interval and time-stamped with the central time of the interval. For hourly data, for example, these times are 00:30, 01:30, 02:30, …, 23:30 (UTC). The monthly means of time-averaged data are computed from the corresponding sub-daily data.

   C = Time-independent: consists of constant data fields.

   S = Statistics: consists of statistics of selected data fields.

   Note: The daily mean (and daily minimum or maximum) can be computed from a sub-daily data using the Subsetting service, click here for an example.

F: Frequency

   1 = Hourly

   3 = 3-Hourly

   6 = 6-Hourly

   M = Monthly mean : consists data averaged over all time steps within a month

   D = Daily statistics

   U = Monthly-Diurnal mean: consists monthly mean of data at each sub-daily time stamp. For example, M2TUNXSLV_5.12.4 consists monthly mean of data at 00:30, 01:30, …23:30 UTC

   C = Climatology monthly mean ( 30 years mean from 1981 to 2010) 

HV: Horizontal and Vertical

   NX = Two-dimensions (single level).

   NP = Three-dimensions at 42 Pressure levels (level=1 is 1000 hPa). [in long-term climatology M2TCNPLTM, NP = 12 Pressure levels]

   NV = Three-dimensions at 72 model layer center (level=1 is at the top of atmosphere).

   NE = Three-dimensional at 73 model layer edge (level=1 is at the top of atmosphere).

GGG: Group

   ANA = direct analysis products.

   ASM = assimilated state variables (please read more in System Document).

   AER = aerosol mixing ratio.

   ADG = aerosol extended diagnostics.

   TDT = tendencies of temperature.

   UDT = tendencies of eastward and northward wind components.

   QDT = tendencies of specific humidity.

   ODT = tendencies of ozone.

   GAS = aerosol optical depth analysis.

   GLC = Land Ice Surface.

   LND = land surface variables.

   LFO = land surface forcing output.

   FLX = surface turbulent fluxes and related quantities.

   MST = moist processes.

   CLD = clouds.

   RAD = radiation.

   CSP = COSP satellite simulator (COSP=CFMIP Observations Simulator Package, CFMIP=Cloud Feedback Model Intercomparison Project).

   TRB = turbulence.

   SLV = single level.

   INT = vertical integrals.

   CHM = chemistry forcing.

   OCN = ocean.

   NAV = vertical coordinates.


Groups for the derived products: 

   EDI = extremes detection indices 

   PCT = percentiles

   LTM = long-term mean (30 years mean)

Document TypeDescription
FAQs

Science FAQs: Frequently asked questions about the data science content, algorithm, and data processing information, for example:

  • What is the difference between the ASM and ANA data collections, and how do I choose? 
  • What are the radii of the MERRA-2 aerosols in each of the bins?
  • What are the MERRA-2 soil moisture variables and their units?

Data Access FAQs: Frequently asked questions about general data information, how to find, download, read and view data, for example:

  • What is the data Latency of MERRA-2?
  • Do MERRA and MERRA-2 have rainfall data?
  • How can I subset and download a large amount of the MERRA-2 data?
Data How-tos

Data How-tos are examples with step-by-step instructions and screenshots illustrating how to access or download data, such as:

  • How to Download MERRA-2 Daily Mean Data?
  • How to Obtain a Time Series at a Single Point using TDS?
  • How to Use the Web Services API for Subsetting MERRA-2 Data 


The full name for the MERRA-2 standrad products consists of three dot-delimited nodes:

      runid.collection.timestamp

where, 

      runid = MERRA2_SVv 

S and Vv denote the production Stream and the Version numbers. MERRA-2 was run in four production Streams. The Version number is usually zero, denoting the original processing. If the version number is none zero, it is a reprocessed data. The runid values for the four streams are listed below:

runidBegin_dateEnd_date
MERRA2_1001980.01.011991.12.31
MERRA2_2001992.01.012000.12.31
MERRA2_3002001.01.012010.12.31
MERRA2_4002011.01.01present

An example of a runid for reprocessed data is the month of September 2020, where runid = MERRA2_401 (rather than MERRA2_400). 

Read more information on "collection" and "timestamp" in Section 5.1 of the MERRA-2 File Specification.

Find MERRA-2 data which have been reprocessed.

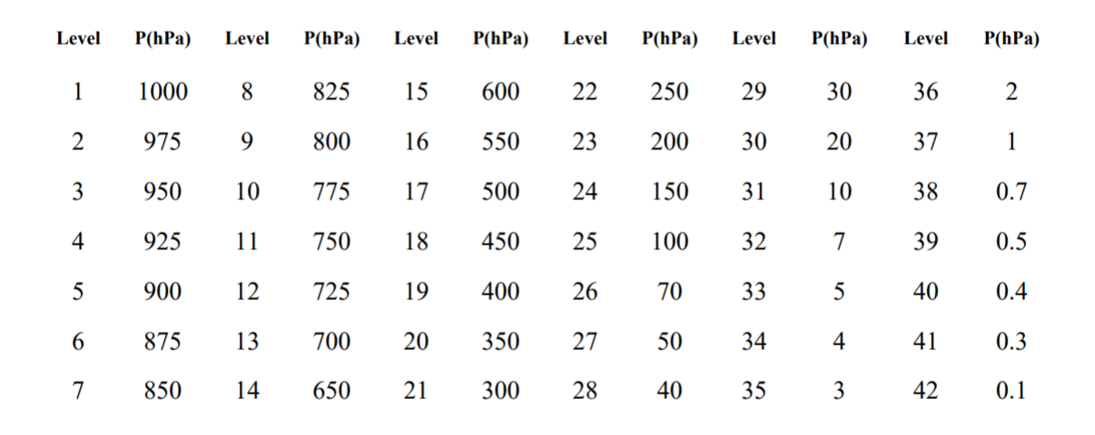
Pressure-level data will be output on the following 42 pressure levels:

Image

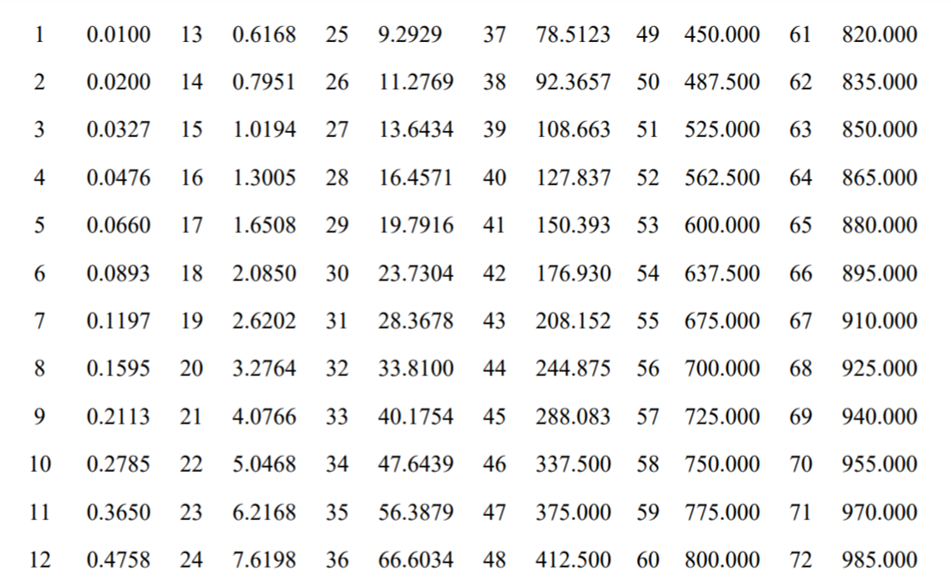
Products on the native vertical grid will be output on the following model layers. Pressures are nominal for a 1000 hPa surface pressure and refer to the top edge of the layer. Note that the bottom layer has a nominal thickness of 15 hPa.

Image

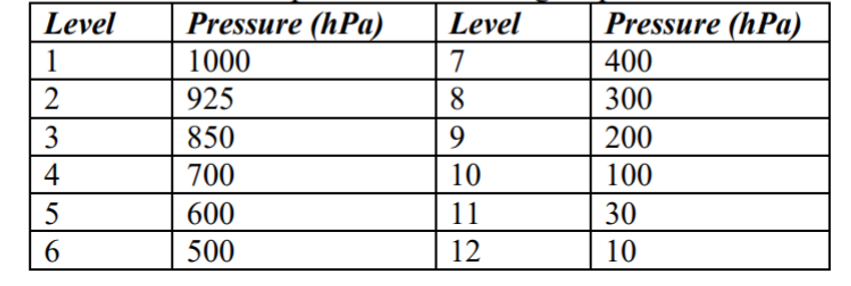
MERRA-2 long-term mean data (M2TCNPLTM) will be output on the following 12 pressure levels:

Image

Migration Status

  • All MERRA-2 collections have been migrated to the cloud archive in the AWS US-West-2 region.  Direct S3 access and HTTPS access from the cloud archive is now available for all MERRA-2 data.
  • The migration of the cloud data services is in progress:
  • The current on-premise data and services remain the same until further notice. 

Access data in the Cloud 

Gelaro, R., W. McCarty, M. J. Suárez, R. Todling, A. Molod, L. Takacs, C. A. Randles, A. Darmenov, M. G. Bosilovich, R. Reichle, et al. (2017), The Modern-Era Retrospective Analysis for Research and Applications, Version 2 (MERRA-2)., J. Climate, 30(14), doi:10.1175/JCLI-D-16-0758.1

Molod, A., L. Takacs, M. Suarez, and J. Bacmeister (2015), Development of the GEOS-5 atmospheric general circulation model: evolution from MERRA to MERRA2., Geosci. Model Dev., 8, doi:10.5194/gmd-8-1339-2015

Randles, C. A., A. M. da Silva, V. Buchard, P. R. Colarco, A. Darmenov, R. Govindaraju, A. Smirnov, B. Holben, R. Ferrare, J. Hair, Y.Shinozuka, and C.J. Flynn (2017), The MERRA-2 Aerosol Reanalysis, 1980 Onward. Part I: System Description and Data Assimilation Evaluation., J. Climate, 30(17), doi:10.1175/JCLI-D-16-0609.1

Buchard V., C. A. Randles, A. M. da Silva, A. Darmenov, P. R. Colarco, R. Govindaraju, R. Ferrare, J. Hair, A. J. Beyersdorf, L. D. Ziemba, H. Yu (2017), The MERRA-2 aerosol reanalysis, 1980 onward. Part II: Evaluation and case studies., J. Climate, 30(17), doi:10.1175/JCLI-D-16-0613.1

Reichle, R.H., Q. Liu, R.D. Koster, C.S. Draper, S.P.P. Mahanama, and G.S. Partyka (2017), Land Surface Precipitation in MERRA-2., J. Climate, 30(5), doi:10.1175/JCLI-D-16-0570.1

Reichle, R. H., C. S. Draper, Q. Liu, M. Girotto, S. P. P. Mahanama, R. D. Koster, and G. J. M. De Lannoy (2017), Assessment of MERRA-2 Land Surface Hydrology Estimates., J. Climate, 30(8), doi:10.1175/JCLI-D-16-0720.1

Rienecker, M. M., and Coauthors, 2008: The GEOS-5 Data Assimilation System—Documentation of versions 5.0.1 and 5.1.0, and 5.2.0. NASA Tech. Rep. Series on Global Modeling and Data Assimilation, NASA/TM-2008-104606, Vol. 27, 92 pp.

Bosilovich, M. G., S. Akella, L. Coy, R. Cullather, C. Draper, R. Gelaro, R. Kovach, Q.Liu, A. Molod, P. Norris, K. Wargan, W. Chao, R. Reichle, L. Takacs, Y. Vikhliaev, S. Bloom, A. Collow, S. Firth, G. Labow, G. Partyka, S. Pawson, O. Reale, S. D. Schubert, and M. Suarez (2015), 2015b: MERRA-2: Initial Evaluation of the Climate, Technical Report Series on Global Modeling and Data Assimilation, 43, NASA/TM–2015-104606/Vol. 43

Collins, N., G. Theurich, C. DeLuca, M. Suarez, A. Trayanov, V. Balaji, P. Li, W. Yang, C. Hill, and A. da Silva (2005), Design and implementation of components in the Earth System Modeling Framework, International Journal of High Performance Computing Applications, doi:10.1177/1094342005056120

Collow, A., V. Buchard, M. Chin, P. Colarco, A. Darmenov, and A. da Silva, 2023: Supplemental Documentation for GEOS Aerosol Products. GMAO Office Note No. 22 (Version 1.0), 8 pp.
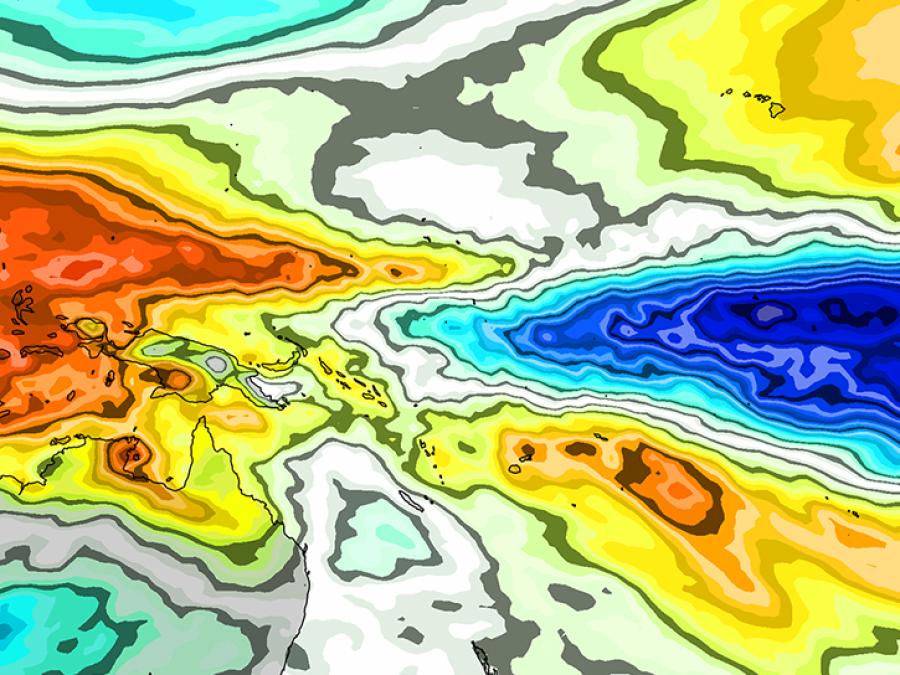
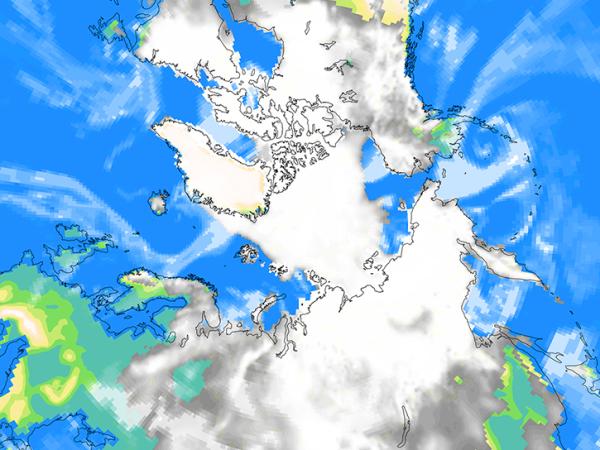
Table 1: Overview of MERRA and MERRA-2 projects


MERRAMERRA-2
Version of GEOS model*5.2.05.12.4
Renalysis Atmospheric reanalysis for the satellite eraAtmospheric reanalysis for the satellite era, including coupled aerosols
Number of collections66100
Year of Release / deprecation2008 / 20162016 / ongoing
Temporal CoverageJan 1, 1979 → Feb 29, 2016Jan 1, 1980 → present
Spatial Coverage Global Global 
Spatial Resolution0.5° × 0.667° grid with 72 model layers0.5° × 0.625° grid with 72 model layers
Temporal Resolution1-hour, 3-hour, monthly mean, monthly diurnal1-hour, 3-hour, daily, monthly mean, monthly diurnal, climate mean
Data format HDF-EOS2NetCDF

* GEOS: The Goddard Earth Observing System Model. This version of the GEOS model is used to generate MERRA or MERRA-2. 


Table 2: List of MERRA Time-independent collections

This table includes both ESDT and GMAO shortname as well as the dataset Digital Object Identifiers (DOIs), along with their MERRA-2 counterparts. (Note that the hyperlink for each MERRA collection redirects users to the landing page of its MERRA-2 counterpart. However, in the case of no MERRA-2 counterpart (i.e., N/A), the hyperlink of that MERRA collection redirects users to this webpage. 

Time-independent Collections
MERRA Collection Shortnames and DOI MERRA-2 Collection Shortnames and DOICollection Description 
MAC0NASM (const_2d_asm_Nx) doi:10.5067/HEE4F4IL912IM2C0NXASM (const_2d_asm_Nx) doi:10.5067/ME5QX6Q5IGGUDAS 2D constant

Table 3: List of MERRA Analysis collections

This table includes both ESDT and GMAO shortname as well as the dataset Digital Object Identifiers (DOIs), along with their MERRA-2 counterparts. (Note that the hyperlink for each MERRA collection redirects users to the landing page of its MERRA-2 counterpart. However, in the case of no MERRA-2 counterpart (i.e., N/A), the hyperlink of that MERRA collection redirects users to this webpage. 

Analysis Collections 
MERRA Collection Shortnames and DOIMERRA-2 Collection Shortnames and DOICollection Description 
MAI6NVANA (inst6_3d_ana_Nv) doi:10.5067/WGY2HAX25374M2I6NVANA (inst6_3d_ana_Nv) doi:10.5067/IUUF4WB9FT4W6-Hourly,Instantaneous,Model-Level,Analyzed Meteorological Fields
MAI6NPANA (inst6_3d_ana_Np) doi:10.5067/ADAWH64DCRU0M2I6NPANA (inst6_3d_ana_Np) doi:10.5067/A7S6XP56VZWS6-Hourly,Instantaneous,Pressure-Level,Analyzed Meteorological Fields
MAIMNPANA (instM_3d_ana_Np) doi:10.5067/DO94EIBSPTVKM2IMNPANA (instM_3d_ana_Np) doi:10.5067/V92O8XZ30XBIMonthly Mean,Pressure-Level, Analyzed Meteorological Fields
MAIUNPANA (instU_3d_ana_Np) doi:10.5067/8NEYZ8WH8ZTZM2IUNPANA (instU_3d_ana_Np) doi:10.5067/TRD91YO9S6E7Diurnal,Instantaneous,Pressure-Level,Analyzed Meteorological Fields

Table 4: List of MERRA Historical collections

This table includes both ESDT and GMAO shortname as well as the dataset Digital Object Identifiers (DOIs), along with their MERRA-2 counterparts. (Note that the hyperlink for each MERRA collection redirects users to the landing page of its MERRA-2 counterpart. However, in the case of no MERRA-2 counterpart (i.e., N/A), the hyperlink of that MERRA collection redirects users to this webpage. 

Historical Collections
MERRA Collection Shortnames and DOI MERRA-2 Collection Shortnames and DOICollection Description 
MAI3CPASM (inst3_3d_asm_Cp) doi:10.5067/8D4LU4390C4SM2I3NPASM (inst3_3d_asm_Np) doi:10.5067/QBZ6MG944HW03-Hourly,Instantaneous,Pressure-Level,Assimilated Meteorological Fields
MAIMCPASM (instM_3d_asm_Cp) doi:10.5067/YX0AVASQRTNWM2IMNPASM (instM_3d_asm_Np) doi:10.5067/2E096JV59PKMonthly Mean,Pressure-Level, Assimilated Meteorological Fields
MAIUCPASM (instU_3d_asm_Cp) doi:10.5067/BUFAR1DPYIR9M2IUNPASM (instU_3d_asm_Np) doi:10.5067/6EGRBNEBMIYSDiurnal,Instantaneous,Pressure-Level,Assimilated Meteorological Fields
MAT3CPCLD (tavg3_3d_cld_Cp) doi:10.5067/TW0W0RC88E9AM2T3NPCLD (tavg3_3d_cld_Np) doi:10.5067/TX10URJSKT533-Hourly,Time-Averaged,Pressure-Level,Assimilation,Cloud Diagnostics
MATMCPCLD (tavgM_3d_cld_Cp) doi:10.5067/ZCUTDLD0K5J5M2TMNPCLD (tavgM_3d_cld_Np) doi:10.5067/J9R0LXGH48JRMonthly, Mean, Pressure-Level,Assimilation,Cloud Diagnostics
MATUCPCLD (tavgU_3d_cld_Cp) doi:10.5067/CNZM99S3RG7ZM2TUNPCLD (tavgU_3d_cld_Np) doi:10.5067/EPW7T5UO0C0N3d,Diurnal,Time-Averaged,Pressure-Level,Assimilation,Cloud Diagnostics
MAT3CPMST (tavg3_3d_mst_Cp) doi:10.5067/03WVRVVXCHZXM2T3NPMST (tavg3_3d_mst_Np) doi:10.5067/0TUFO90Q2PMS3-Hourly,Time-Averaged,Pressure-Level,Assimilation,Moist Processes Diagnostics
MATMCPMST(tavgM_3d_mst_Cp) doi:10.5067/4M29ELQ8YCQ7M2TMNPMST(tavgM_3d_mst_Np) doi:10.5067/ZRZGD0DCK1CGMonthly Mean, Pressure-Level,Assimilation, Moist Processes Diagnostics
MATUCPMST (tavgU_3d_mst_Cp) doi:10.5067/Y2GBNRPNXAP9M2TUNPMST (tavgU_3d_mst_Np) doi:10.5067/ZRSN0JU27DK23d,Diurnal,Time-Averaged,Pressure-Level,Assimilation,Moist Processes Diagnostics
MAT3CPRAD (tavg3_3d_rad_Cp) doi:10.5067/DNZTCFMAG3FWM2T3NPRAD (tavg3_3d_rad_Np) doi:10.5067/3UGE8WQXZAOK3-Hourly,Time-Averaged,Pressure-Level,Assimilation,Radiation Diagnostics
MATUCPRAD (tavgU_3d_rad_Cp) doi:10.5067/LH1YI6ZWQ7USM2TUNPRAD (tavgU_3d_rad_Np) doi:10.5067/H140JMDOWB0YDiurnal,Time-Averaged,Pressure-Level,Assimilation,Radiation Diagnostics
MATMCPRAD (tavgM_3d_rad_Cp) doi: 10.5067/7SCF81BU67P5M2TMNPRAD (tavgM_3d_rad_Np) doi:10.5067/H3YGROBVBGFJMonthly Mean,Pressure-Level,Assimilation,Radiation Diagnostics
MAT3CPTRB (tavg3_3d_trb_Cp) doi:10.5067/GOESEQLL1OT2M2T3NPTRB (tavg3_3d_trb_Np) doi:10.5067/ZRRJPGWL8AVL3-Hourly,Time-Averaged,Pressure-Level,Assimilation,Turbulence Diagnostics
MATMCPTRB (tavgM_3d_trb_Cp) doi:10.5067/QA89B6E18FPDM2TMNPTRB (tavgM_3d_trb_Np) doi:10.5067/2YOIQB5C3ACNMonthly Mean,Pressure-Level,Assimilation,Turbulence Diagnostics
MATUCPTRB (tavgU_3d_trb_Cp) doi:10.5067/IQIC17GD3IBJM2TUNPTRB (tavgU_3d_trb_Np) doi:10.5067/2A99C60CG7WC3d,Diurnal,Time-Averaged,Pressure-Level,Assimilation,Turbulence Diagnostics
MAT3CPTDT (tavg3_3d_tdt_Cp) doi:10.5067/RP02UMM6LH1BM2T3NPTDT (tavg3_3d_tdt_Np) doi:10.5067/9NCR9DDDOPFI 3-Hourly,Time-Averaged,Pressure-Level,Assimilation,Temperature Tendencies
MATMCPTDT (tavgM_3d_tdt_Cp) doi:10.5067/0ASY0WOAY6B7M2TMNPTDT (tavgM_3d_tdt_Np) doi:10.5067/VILT59HI2MOYMonthly Mean,Pressure-Level,Assimilation,Temperature Tendencies
MATUCPTDT (tavgU_3d_tdt_Cp) doi:10.5067/MD8MXR7AT7SLM2TUNPTDT (tavgU_3d_tdt_Np) doi:10.5067/QPO9E5TPZ8OF3d,Diurnal,Time-Averaged,Pressure-Level,Assimilation,Temperature Tendencies
MAT3CPUDT (tavg3_3d_udt_Cp) doi:10.5067/BVOFEHG7TR07M2T3NPUDT (tavg3_3d_udt_Np) doi:10.5067/CWV0G3PPPWFW3-Hourly,Time-Averaged,Pressure-Level,Assimilation,Wind Tendencies
MATMCPUDT (tavgM_3d_udt_Cp) doi:10.5067/8T03TZ8Q2FUVM2TMNPUDT (tavgM_3d_udt_Np) doi:10.5067/YSR6IA5057XXMonthly Mean,Pressure-Level,Assimilation,Wind Tendencies
MATUCPUDT (tavgU_3d_udt_Cp) doi:10.5067/G0OZII3GJUFOM2TUNPUDT (tavgU_3d_udt_Np) doi:10.5067/DO715T7T5PG83d,Diurnal,Time-Averaged,Pressure-Level,Assimilation,Wind Tendencies 
MAT3CPQDT (tavg3_3d_qdt_Cp) doi:10.5067/V365884H75QSM2T3NPQDT (tavg3_3d_qdt_Np) doi:10.5067/A9KWADY78YHQ3-Hourly,Time-Averaged,Pressure-Level,Assimilation,Moist Tendencies
MATMCPQDT (tavgM_3d_qdt_Cp) doi:10.5067/IKOB0OFBQSQZM2TMNPQDT (tavgM_3d_qdt_Np) doi:10.5067/2ZTU87V69ATPMonthly Mean,Pressure-Level,Assimilation, Moist Tendencies
MATUCPQDT (tavgU_3d_qdt_Cp) doi:10.5067/UZAIGK5VQY08M2TUNPQDT (tavgU_3d_qdt_Np) doi:10.5067/S8HJXIR0BFTS3d,Diurnal,Time-Averaged,Pressure-Level,Assimilation,Moist Tendencies
MAT3CPODT (tavg3_3d_odt_Cp) doi:10.5067/JFFR2J7H4CGMM2T3NPODT (tavg3_3d_odt_Np) doi:10.5067/S0LYTK57786Z3-Hourly,Time-Averaged,Pressure-Level,Assimilation,Ozone Tendencies
MATMCPODT (tavgM_3d_odt_Cp) doi:10.5067/L4R625MTJQMDM2TMNPODT (tavgM_3d_odt_Np) doi:10.5067/Z2KCWAV4GPD2Monthly Mean,Pressure-Level,Assimilation, Ozone Tendencies
MATUCPODT (tavgU_3d_odt_Cp) doi:10.5067/0L7VCF36DL1RM2TUNPODT (tavgU_3d_odt_Np) doi:10.5067/M8OJ09GZP23E3d,Diurnal,Time-Averaged,Pressure-Level,Assimilation,Ozone Tendencies
MAT1NXSLV (tavg1_2d_slv_Nx) doi:10.5067/B6DQZQLSFDLHM2T1NXSLV (tavg1_2d_slv_Nx) doi:10.5067/VJAFPLI1CSIV1-Hourly,Time-Averaged,Single-Level,Assimilation,Single-Level Diagnostics
MATMNXSLV (tavgM_2d_slv_Nx) doi:10.5067/W3UEUC5V7M9MM2TMNXSLV (tavgM_2d_slv_Nx) doi:10.5067/AP1B0BA5PD2KMonthly Mean,Single-Level,Assimilation, Single-Level Diagnostics
MATUNXSLV (tavgU_2d_slv_Nx) doi:10.5067/OKP99VQR4C63M2TUNXSLV (tavgU_2d_slv_Nx) doi:10.5067/AFOK0TPEVQEKMERRA 2D IAU Diagnostic, Single Level Meteorology, Diurnal
MAT1NXFLX (tavg1_2d_flx_Nx) doi:10.5067/4EQ54AKI405RM2T1NXFLX (tavg1_2d_flx_Nx) doi:10.5067/7MCPBJ41Y0K61-Hourly,Time-Averaged,Single-Level,Assimilation,Surface Flux Diagnostics
MATMNXFLX (tavgM_2d_flx_Nx) doi:10.5067/JX8Q6J3NH5QDM2TMNXFLX (tavgM_2d_flx_Nx) doi:10.5067/0JRLVL8YV2Y4MERRA 2D IAU Diagnostic, Surface Fluxes, Monthly Mean
MATUNXFLX (tavgU_2d_flx_Nx) doi:10.5067/HN9F4C3SHW5AM2TUNXFLX (tavgU_2d_flx_Nx) doi:10.5067/LUHPNWAKYIO3MERRA 2D IAU Diagnostic, Surface Fluxes, Diurnal
MAT1NXRAD (tavg1_2d_rad_Nx) doi:10.5067/RI9VTUQN74XJM2T1NXRAD (tavg1_2d_rad_Nx) doi:10.5067/Q9QMY5PBNV1T1-Hourly,Time-Averaged,Single-Level,Assimilation,Radiation Diagnostics
MATMNXRAD (tavgM_2d_rad_Nx) doi:10.5067/6UX3EDUNVUFKM2TMNXRAD (tavgM_2d_rad_Nx) doi:10.5067/OU3HJDS973O0Monthly Mean,Single-Level,Assimilation, Radiation Diagnostics
MATUNXRAD (tavgU_2d_rad_Nx) doi:10.5067/F992PMIHBH0GM2TUNXRAD (tavgU_2d_rad_Nx) doi:10.5067/4SDCJYK8P9QUDiurnal,Time-Averaged,Single-Level,Assimilation, Radiation Diagnostics
MAT1NXLND (tavg1_2d_lnd_Nx) doi:10.5067/YL8Z7MICQZF9M2T1NXLND (tavg1_2d_lnd_Nx) doi:10.5067/RKPHT8KC1Y1T1-Hourly,Time-Averaged,Single-Level,Assimilation,Land Surface Diagnostics
MATMNXLND (tavgM_2d_lnd_Nx) doi:10.5067/XOHTIIK0W9RKM2TMNXLND (tavgM_2d_lnd_Nx) doi:10.5067/8S35XF81C28FMonthly Mean,Single-Level,Assimilation,Land Surface Diagnostics
MATUNXLND (tavgU_2d_lnd_Nx) doi:10.5067/8LXGGREWG0YFM2TUNXLND (tavgU_2d_lnd_Nx) doi:10.5067/W0J15047CF6NDiurnal,Time-Averaged,Single-Level,Assimilation,Land Surface Diagnostics
MAT1NXOCN (tavg1_2d_ocn_Nx) doi:10.5067/678J8KM836JWM2T1NXOCN (tavg1_2d_ocn_Nx) doi:10.5067/Y67YQ1L3ZZ4R1-Hourly,Time-Averaged,Single-Level,Assimilation,Ocean Surface Diagnostics
MATMNXOCN (tavgM_2d_ocn_Nx) doi:10.5067/LH0VEHYM7Y8ZM2TMNXOCN (tavgM_2d_ocn_Nx) doi:10.5067/4IASLIDL8EECMonthly Mean,Single-Level,Assimilation,Ocean Surface Diagnostics
MATUNXOCN (tavgM_2d_ocn_Nx) doi:10.5067/F9U8V5L6EYSTM2TUNXOCN (tavgU_2d_ocn_Nx) doi:10.5067/KLNAVGAX7J66Diurnal,Time-Averaged,Single-Level,Assimilation,Ocean Surface Diagnostics
MAI1NXINT (inst1_2d_int_Nx) doi:10.5067/G09SADROGUJ1M2I1NXINT (inst1_2d_int_Nx) doi:10.5067/G0U6NGQ3BLE01-hourly, Instantaneous, 2D vertical integrals and budget terms
MAIMNXINT (instM_2d_int_Nx) doi:10.5067/QL0PGBK2CYJSM2IMNXINT (instM_2d_int_Nx) doi:10.5067/KVTU1A8BWFSJMonthly Mean,Single-Level, Assimiated Vertically Integrated Diagnostics
MAIUNXINT (instU_2d_int_Nx) doi:10.5067/UO7L2B5NFYUPM2IUNXINT (instU_2d_int_Nx) doi:10.5067/DGAB3HFEYMLYDiurnal Instantaneous,Single-Level,Vertically Integrated Diagnostics
MAT1NXINT (tavg1_2d_int_Nx) doi:10.5067/GQC5N9KQ2V08M2T1NXINT (tavg1_2d_int_Nx) doi:10.5067/Q5GVUVUIVGO71-Hourly,Time-Averaged,Single-Level,Assimilation,Vertically Integrated Diagnostics
MATMNXINT (tavgM_2d_int_Nx) doi:10.5067/JBJDIWKAEU03M2TMNXINT (tavgM_2d_int_Nx) doi:10.5067/FQPTQ4OJ22TLMonthly Mean,Single-Level, Assimilation,Vertically Integrated Diagnostics
MATUNXINT (tavgU_2d_int_Nx) doi:10.5067/49IH37L9PTFRM2TUNXINT (tavgU_2d_int_Nx) doi:10.5067/R2MPVU4EOSWTMERRA 2D IAU Diagnostic, Vertical Integrals and Budget Terms, Diurnal

Table 5: List of MERRA Chemistry Forcing collections

This table includes both ESDT and GMAO shortname as well as the dataset Digital Object Identifiers (DOIs), along with their MERRA-2 counterparts. (Note that the hyperlink for each MERRA collection redirects users to the landing page of its MERRA-2 counterpart. However, in the case of no MERRA-2 counterpart (i.e., N/A), the hyperlink of that MERRA collection redirects users to this webpage. 

Chemistry Forcing Collections
MERRA Collection Shortnames and DOIMERRA-2 Collection Shortnames and DOICollection Description 
MAC0FXCHM (const_2d_chm_Fx) doi:10.5067/SKUZ0LM7V0NZN/AMERRA 2-D invariants on chemistry grid
MAT3FVCHM (tavg3_3d_chm_Fv) doi:10.5067/T090IC50UTTON/AMERRA Chem 3D IAU States Cloud Precip, Time average 3-hourly
MAT3FECHM (tavg3_3d_chm_Fe) doi:10.5067/LMO1V37720QBN/AMERRA Chem 3D IAU, Precip Mass Flux, Time average 3-hourly
MAT3FXCHM (tavg3_2d_chm_Fx) doi:10.5067/1GTO5H32Z7M1N/AMERRA Chem 2D IAU Diagnostics, Fluxes and Meteorology, Time Average 3-hourly
MATMFXCHM (tavgM_2d_chm_Fx) doi:10.5067/IYDN3LNZ63UEN/AMERRA Chem 2D IAU Diagnostics, Fluxes and Meteorology, Monthly Mean
MATUFXCHM (tavgU_2d_chm_Fx) doi:10.5067/J0OQ0KN7139FN/AMERRA Chem 2D IAU Diagnostics, Fluxes and Meteorology, Diurnal
MAT3NVCHM (tavg3_3d_chm_Nv) doi:10.5067/2KS2FY49J579N/AMERRA Chem 3D IAU C-Grid Edge Mass Flux, Time Average 3-Hourly
MAT3NECHM (tavg3_3d_chm_Ne) doi:10.5067/WY64R563N9D8N/AMERRA Chem 3D IAU C-Grid Edge Mass Flux, Time Average 3-Hourly
MAI3NECHM (inst3_3d_chm_Ne) doi:10.5067/R07F7ONCKX9IN/A3-Hourly,Instantaneous,Model-Level,Assimilated Pressure