Introduction

Data products distributed by NASA's Land Processes Distributed Active Archive Center (LP DAAC) are used in many different Earth Science applications. LP DAAC products play an important role in modeling, detecting changes to the landscape, and assessing ecosystem variables, to name a few. Three of those applications, published between July and September 2019, are highlighted below.

Soybean Modeling in Brazil and the U.S.

Moderate Resolution Imaging Spectroradiometer (MODIS) Normalized Difference Vegetation Index (NDVI) and Enhanced Vegetation Index (EVI) and Leaf Area Index (LAI) data were used to calibrate soybean crop growth models in the absence of in-situ data.

Image
Image Caption

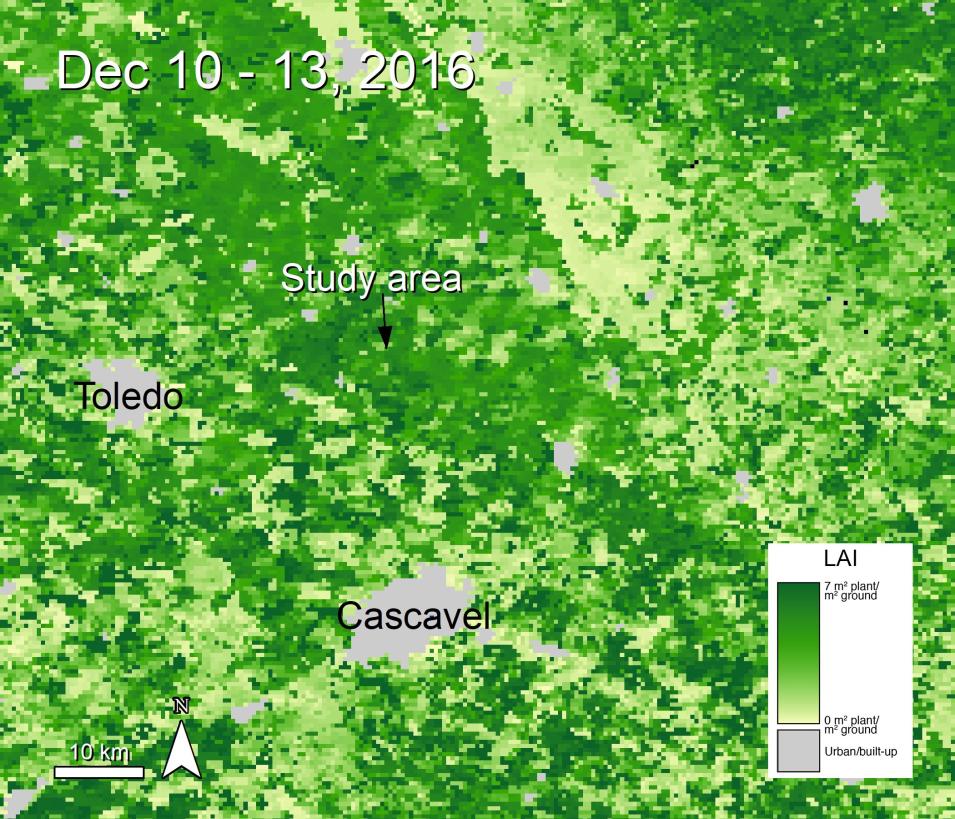
Combined Terra and Aqua MODIS LAI data over Richetti and others’ (2019) study area during the peak LAI period for soybeans, as identified by the authors. This data was downloaded using AppEEARS.

Science Objectives

Richetti and others (2019) set out to investigate if remote sensing data can be used to calibrate genetic specific parameters (GSPs) for crop growth models to improve predicting soybean crop yields. The researchers published their study "Remotely sensed vegetation index and LAI for parameter determination of the CSM-CROPGRO-Soybean model when in situ data are not available" in the International Journal of Applied Earth Observation and Geoinformation.

Instruments Used

The authors use NDVI and EVI data from the Terra and Aqua MODIS vegetation indices products (MOD13Q1 and MYD13Q1) and LAI data from the Combined Terra and Aqua MODIS data product (MCD15A3H) during the growing season of 2016–2017 over commercial farms in Paraná, Brazil, and Iowa, United States. The MODIS data were retrieved using the LP DAAC’s Application for Extracting and Exploring Analysis Ready Samples (AppEEARS) web-based application.

Major Findings

These data were used to calibrate cultivar parameters for the CSM-CROPGRO-Soybean model. The authors found that these data can be used to calibrate GSPs for crop growth models when in-situ data are not available. In addition, the authors found that MODIS LAI and light interception data provided results on pod weight and biomass prediction that were considered as good as the in-situ data.

References

Publication Reference

Richetti, J., Boote, K.J., Hoogenboom, G., Judge, J., Johann, J.A., and Uribe-Opazo, M.A., 2019, Remotely sensed vegetation index and LAI for parameter determination of the CSM-CROPGRO-Soybean model when in situ data are not available: International Journal of Applied Earth Observation and Geoinformation, v. 79, p. 110–115. doi:10.1016/j.jag.2019.03.007

Image References

Granule ID
  • MCD15A3H.A2016345.h13v11.006.2016350220814
Data Citation

Myneni, R., Knyazikhin, Y., and Park, T., 2015, MCD15A3H MODIS/Terra+Aqua Leaf Area Index/FPAR 4-day L4 Global 500m SIN Grid V006: NASA EOSDIS Land Processes DAAC, accessed 2019-09-24, at doi:10.5067/MODIS/MCD15A3H.006.

Hurricane and Drought Impacts in the Caribbean

In the study "Hurricane damage detection on four major Caribbean islands: Remote Sensing of Environment" published in Remote Sensing of Environment, De Beurs and others (2019) use MODIS Bidirectional Reflectance Distribution Function (BRDF) data for reflectance and disturbance indices to study landscape recovery following hurricanes and droughts.

Image
Image Caption

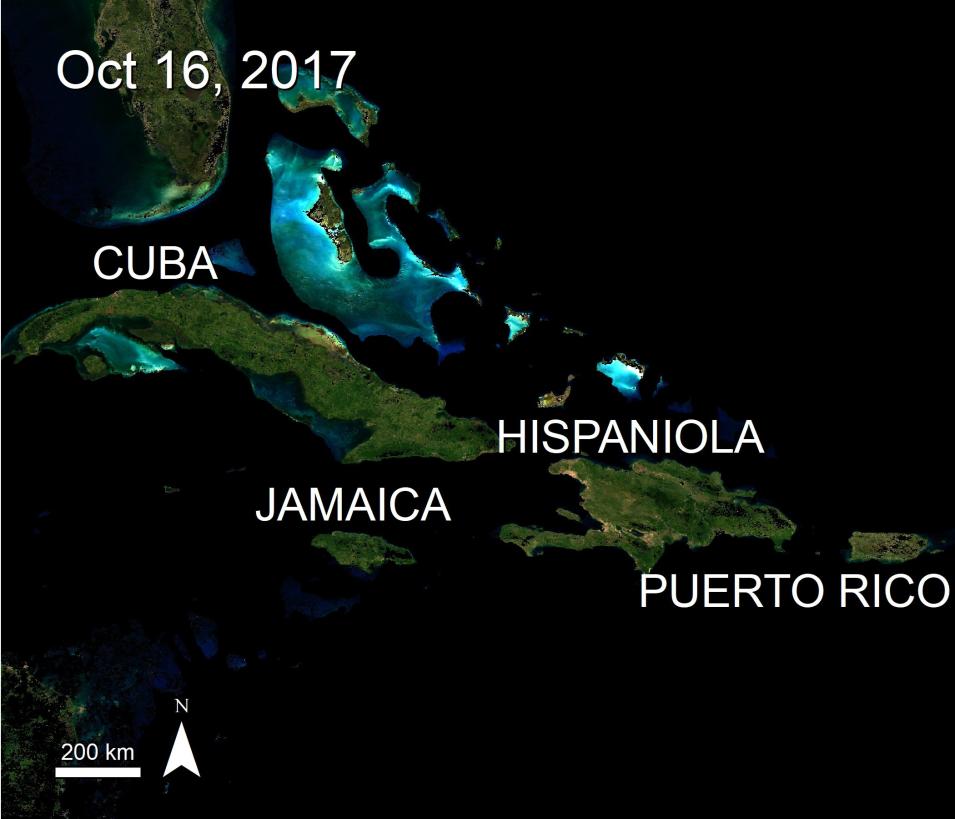
True color composite of Combined Terra and Aqua MODIS normalized BRDF-adjusted reflectance data over the Caribbean region. Data from this date was used to validate De Beurs and others’ (2019) results with other commercial data.

Science Objectives

In the past, MODIS Vegetation Indices data have been used to study hurricanes after individual hurricane events. It is believed that as sea surface temperatures continue to rise, the potential for more intense and destructive hurricanes with longer lifetimes will also increase. With land temperature increases occurring as well, the rate of drying is also expected to increase. This could cause more intense droughts in a shorter time period, as seen in the Caribbean region.

Instruments Used

Originally De Beurs and others (2016) created a MODIS-derived disturbance index (DI) based on standardized tasseled cap brightness, greenness, and wetness data. The authors found that the MODIS record, 2000 to present, offers a sufficiently long time series to provide a standardized comparison for their DI. In the paper the authors use MODIS Nadir Bidirectional Reflectance Distribution Function (BRDF)-Adjusted Reflectance (NBAR) (MCD43A4) data from 2000 to 2017 to study the impacts of hurricanes and droughts on the four largest Caribbean islands: Cuba, Hispaniola (location of Haiti and the Dominican Republic), Puerto Rico, and Jamaica.

Major Findings

The authors calculate MODIS tasseled cap metrics and generate a disturbance index. Higher DI values (3 or above) suggest significant disturbance. Disturbed land varied between 0 and 50%, with the highest percentages corresponding to major droughts in Cuba and damage from Hurricane Maria in Puerto Rico. For example, Hurricane Maria caused significant disturbance across 50% of Puerto Rico. DI values on vegetated land rose to 3.37, and recovery did not begin until 2.5 months after landfall. The authors believe their approach enables a better understanding of the combined effects of hurricanes and droughts across island landscapes.

References

Publication Reference

De Beurs, K.M., McThompson, N.S., Owsley, B.C., and Henebry, G.M., 2019, Hurricane damage detection on four major Caribbean islands: Remote Sensing of Environment, v. 229, p. 1–13. doi:10.1016/j.rse.2019.04.028

Image References

Granule IDs
  • MCD43A4.A2017289.h10v06.006.2017298032935
  • MCD43A4.A2017289.h10v07.006.2017298031241
  • MCD43A4.A2017289.h11v06.006.2017298032929
  • MCD43A4.A2017289.h11v07.006.2017298031228
Data Citation

Schaaf, C., and Wang, Z., 2015, MCD43A4 MODIS/Terra+Aqua BRDF/Albedo Nadir BRDF Adjusted Ref Daily L3 Global - 500m V006: NASA EOSDIS Land Processes DAAC, accessed 2019-09-24, at doi:10.5067/MODIS/MCD43A4.006.

Dam Site Planning in Northern Iraq

In the study "Dam site suitability assessment at the Greater Zab River in northern Iraq using remote sensing data and GIS" published in the Journal of Hydrology, Noori and others (2019) use Advanced Spaceborne Thermal Emission and Reflection Radiometer (ASTER) instrument elevation data and Fuzzy Logic modeling to assess dam construction suitability along Iraq's Greater Zab River.
Image
Image Caption

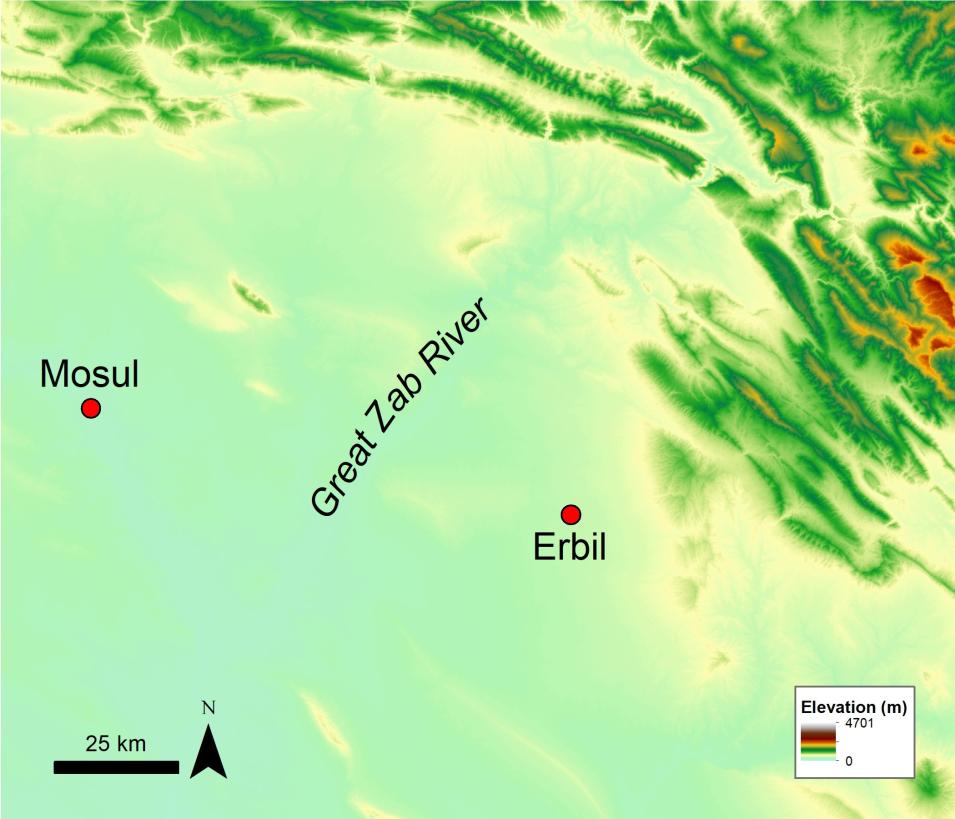
An ASTER GDEM image of a portion of the Great Zab River in northern Iraq, the study area of Noori and others (2019).

Science Objectives

Within the last few decades northern Iraq has seen a lot of long-term droughts and water shortages, but also occasional flooding that relates to the changing climate. According to Noori and others (2019) one strategy to combat the issues relating to droughts and floods in the area is to construct dams. Dams can help control flooding, increase the water supply for irrigation and drinking water, and provide the area with hydroelectric power.

Instruments Used

The authors set out to find suitable areas for future dam construction along the Greater Zab River using Landsat 8, Terra ASTER Global Digital Elevation Model (GDEM) (ASTGTM) remote sensing data, and local data on soil, climate, and rainfall, in combination with GIS software and multi-criteria decision making techniques. The authors specifically use the Terra ASTER GDEM data to extract information on drainage networks, stream flow, altitude, and slope.

Major Findings

The authors compared the traditionally used analytic hierarchy process (AHP) against Fuzzy Logic for determining site suitability and found Fuzzy Logic to be more accurate. Maps of dam locations, created by the Fuzzy Logic model, were then combined with data generated by ASTER GDEM (drainage network, contour lines, and triangulated irregular network data) to create a ranking system based on storage and dam length. Four suitable dam sites were discovered, one of which was the best site for water harvesting. The next step will be for field visits to confirm the final location for a future dam. The authors believe their methods can be replicated in other areas around the world for similar applications.

References

Publication Reference

Noori, A.M., Pradhan, B., and Ajaj, Q.M., 2019, Dam site suitability assessment at the Greater Zab River in northern Iraq using remote sensing data and GIS: Journal of Hydrology, v. 574, p. 964–979. doi:10.1016/j.jhydrol.2019.05.001

Image References

Granule IDs
  • ASTGTM3_N35E043
  • ASTGTM3_N35E044
  • ASTGTM3_N36E043
  • ASTGTM3_N36E044
Data Citation

NASA/METI/AIST/Japan Spacesystems, and U.S./Japan ASTER Science Team, 2019, ASTER Global Digital Elevation Model V003: NASA EOSDIS Land Processes DAAC, accessed 2019-09-24, at doi:10.5067/ASTER/ASTGTM.003.

Details

Last Updated

June 3, 2025

Published

Oct. 28, 2019

Data Center/Project

Land Processes DAAC (LP DAAC)