Land consumption is defined by the UN as the use of land for urbanization, which often involves conversion of land from non-urban to urban functions. It's important to note, however, that there are different definitions of consumption. For example, aspects of "consumed" or "preserved" or available for "development" are applied to cases such as land occupied by wetlands.
Secondly, there is no one, unequivocal measure of whether land that is being developed is truly "newly-developed" (or vacant) land, or if it is at least partially "redeveloped." As a result, the percentage of current total urban land that is newly developed (consumed) is used as a measure of the land consumption rate. NASA has numerous datasets that can be used to aid in the measurement of these two indicators.
Image
 aboard the European Space Agency's Sentinel-2A and -2B twin satellites. Image acquired October 17, 2020.")
Surface reflectance is useful for measuring urbanization and land consumption. Satellite-borne moderate resolution instruments that are used for this measurement include the Moderate Resolution Imaging Spectroradiometer (MODIS) instrument aboard NASA's Terra and Aqua satellites and the Visible Infrared Imaging Radiometer Suite (VIIRS) aboard the joint NASA/NOAA Suomi National Polar-orbiting Partnership (Suomi NPP) satellite and the NOAA-20 satellite. MODIS acquires measurements in 36 spectral bands and at three native spatial resolutions: 250 meters (m), 500 m, and 1,000 m, depending on the band. VIIRS provides 22 spectral bands at two spatial resolutions (375 m and 750 m), which are resampled to 500 m, 1 km, and 0.05 degrees in the NASA produced data products to promote consistency with the MODIS heritage. MODIS data are acquired every one to two days, whereas the wider swath width of VIIRS allows for daily global coverage.
Research quality surface reflectance data products can be accessed directly using NASA Earthdata Search:
NASA's Land Processes Distributed Active Archive Center (LP DAAC) provides a tool called the Application for Extracting and Exploring Analysis Ready Samples (AppEEARS). AppEEARS offers a simple and efficient way to access, transform, and visualize geospatial data, including MODIS and VIIRS surface reflectance data. Two types of sample requests are available: point samples of geographic coordinates or area samples of vector polygons.
NASA's Oak Ridge National Laboratory DAAC (ORNL DAAC) also provides tools for on-demand subsetting of MODIS and VIIRS land data. In particular, the Subsets API allows users to retrieve custom subsets, analytics, and visualizations of MODIS and VIIRS data products.
For higher resolution satellite imagery, the joint NASA/USGS Landsat 7 Enhanced Thematic Mapper (ETM+) and NASA/USGS Landsat 8 Operational Land Imager (OLI) instruments acquire data at 30 m spatial resolution in the visible near-infrared (VNIR) every 16 days (or fewer as you move away from the equator).The USGS archives Landsat data at the USGS Earth Resources Observation and Science (EROS) Center.
Landsat data can be discovered using Earthdata Search. To download Landsat data from the USGS, you will need a USGS Earth Explorer login from the USGS EROS Registration System:
Another higher resolution option is the Harmonized Landsat and Sentinel-2 (HLS) dataset, which takes input data from Landsat 8 and the European Space Agency (ESA) Sentinel-2A and Sentinel-2B satellites to generate a harmonized, analysis-ready surface reflectance data product. The combined measurement enables global land observations every two to three days at 30 m spatial resolution. Note that HLS data are currently provisional.
Explore the Getting Started with Cloud-Native HLS Data in Python Jupyter Notebook for step-by-step instructions about extracting an Enhanced Vegetation Index (EVI) Time Series from HLS. Additional information about HLS is available on the Earthdata HLS Overview page.
The Advanced Spaceborne Thermal Emission and Reflection Radiometer (ASTER)—a cooperative effort between NASA and Japan's Ministry of Economy Trade and Industry—is another high-resolution instrument that acquires visible and near-infrared (VNIR) reflectance data at 15 m resolution, short-wave infrared (SWIR; through 2009) reflectance data at 30 m resolution, and thermal infrared (TIR) data at 90 m resolution. Note that ASTER is a tasked sensor, meaning that it only acquires data when it is directed to do so over specific targets, making its temporal resolution variable depending on the requested target region of interest. ASTER Surface Reflectance products are processed on-demand and must be requested with additional parameters. Note that there is a limit to 2000 granules per order.
Land surface reflectance data can be visualized using NASA Worldview:
GIS-ready: NASA also provides land surface reflectance data from MODIS and HLS through land-based geospatial services.
Image

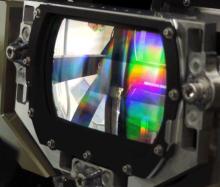
Synthetic Aperture Radar (SAR) imagery provides a unique perspective for monitoring urbanization. SAR instruments are able to penetrate cloud cover and pollution and work in both day and night conditions. In addition, SAR, operating in the microwave portion of the electromagnetic spectrum, captures different target characteristics than optical sensors and provides unique information that complements standard optical remote sensing methods. For information on SAR, check out the What is Synthetic Aperture Radar? Earthdata Backgrounder.
SAR data products can be accessed via Earthdata Search or through NASA's Alaska Satellite Facility DAAC (ASF DAAC). For more information on choosing a dataset, refer to the About the Data section.
- Sentinel-1A and Sentinel-1B SAR data from Earthdata Search
Note: Sentinel-1 operates at C-band and data are available in single or dual polarization. Another option for SAR data is the inclusion of phase information. Level 1 data are produced as single look complex (SLC), in which the phase information is preserved, or as ground-range detected (GRD), in which the phase information is lost. GRD data can be visualized and are appropriate for change detection, for example. - Sentinel-1A and Sentinel-1B SAR data from Vertex
Vertex is ASF DAAC's search tool. Vertex allows for the search, preview, and download of SAR data acquired from a variety of space and airborne platforms, including Sentinel-1. Vertex also includes on-demand SAR processing services, which allow data identified using the Vertex search tools to be processed automatically. This provides analysis-ready products without requiring a lot of knowledge of SAR processing or personal computing resources.
NASA's Uninhabited Aerial Vehicle Synthetic Aperture Radar (UAVSAR) is an L-band, fully polarimetric airborne SAR instrument. Campaigns over portions of Greenland, Iceland, and North, Central, and South America were conducted from 2008 to present.
From 2006 to 2011, the Phased Array type L-band Synthetic Aperture Radar (PALSAR) aboard the Advanced Land Observing Satellite-1 (ALOS) acquired data using multiple observation modes in single, dual, and full polarization. ALOS was a mission of the Japan Aerospace Exploration Agency (JAXA). ALOS PALSAR imagery is distributed by ASF DAAC through an international agreement with JAXA. In addition to standard L-band SAR products, radiometrically terrain corrected (RTC) analysis-ready products are available in GeoTIFF format through Vertex.
To learn more about SAR and processing Level 1 data, please see the Earthdata Getting Started with SAR page and NASA's Applied Remote Sensing Training (ARSET) Introduction to SAR training. In addition, you can view the Earthdata webinars Introduction to SAR Data and Applications of SAR in GIS Environments. ASF DAAC has an extensive collection of SAR Data Recipes that demonstrate many of the applications of SAR in Earth observation.
Image
 Land Cover Type in Worldview.")
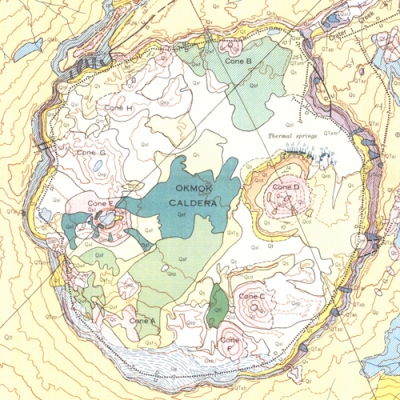
The Terra and Aqua MODIS Land Cover Type data product provides global land cover types at yearly intervals, derived from six different classification schemes (the MODIS Land Cover User Guide provides additional information on these schemes). The product is derived using supervised classifications of MODIS Terra and Aqua reflectance data. The supervised classifications then undergo additional post-processing that further refines specific classes.
LP DAAC's AppEEARS offers the ability to extract subsets, transform, and visualize MODIS and VIIRS land cover-related data products. Two types of sample requests are available: point samples of geographic coordinates or area samples of vector polygons. ORNL DAAC subsetting tools provide a means to simply and efficiently access and visualize MODIS and VIIRS land cover types.
GIS-ready: NASA also provides land cover data through land-based geospatial services.
Image

Vegetation indices measure the amount of green vegetation over a given area and can be used to assess vegetation health. A commonly-used vegetation index is the Normalized Difference Vegetation Index (NDVI), which uses the difference between near-infrared (NIR) and red reflectance divided by their sum. NDVI values range from -1 to 1. Low values of NDVI generally correspond to barren areas of rock, sand, exposed soils, or snow, while higher NDVI values indicate greener vegetation, including forests, croplands, and wetlands. The enhanced vegetation index (EVI) is another widely used vegetation index that minimizes canopy-soil variations and improves sensitivity over dense vegetation conditions.
NDVI and EVI from NASA's MODIS and VIIRS can be accessed in various ways as seen below, and VIIRS provides a global land surface phenology product. A NASA Making Earth System Data Records for Use in Research Environments (MEaSUREs) project from the University of Arizona's Vegetation Index and Phenology Lab has generated seamless and consistent sensor-independent quality measures of landscape phenology parameters and vegetation indices by fusing measurements from different satellite missions and sensors. This Vegetation Continuous Fields (VCF) dataset provides global fractional vegetation cover at 0.05 degree (5,600 meter) spatial resolution at yearly intervals from 1982 to 2016.
Research-quality data products can be accessed directly via Earthdata Search:
- Terra MODIS Vegetation Indices
- Aqua MODIS Vegetation Indices
- VIIRS Vegetation Indices
- VIIRS Land Surface Phenology
- MEaSURES VCF
LP DAAC's AppEEARS offers a simple and effective way to extract, transform, visualize, and download MODIS and VIIRS vegetation-related data products. AppEEARS allows users to subset data by defining specific point(s) or area(s) of interest, and output data can be downloaded in csv (point), GeoTIFF (area), or NetCDF-4 (area) format. Explore LP DAAC's Getting Started with Cloud-Native Harmonized Landsat Sentinel (HLS) Data in Python Jupyter Notebook for extracting an EVI Time Series from HLS.
ORNL DAAC subsetting tools provide a means to simply and efficiently access and visualize MODIS and VIIRS phenology as well as VCF data products. VCF is a global representation of surface vegetation cover as gradations of three ground cover components: percent tree cover, percent non-tree cover, and percent non-vegetated (bare).
Data products can be visualized as a time-averaged map, an animation, seasonal maps, scatter plots, or a time series through an online interactive tool called Giovanni, which was developed by NASA's Goddard Earth Sciences Data and Information Services Center (GES DISC). Follow these steps to plot data in Giovanni: 1) Select a map plot type. 2) Select a date range. Data are in multiple temporal coverages, so be sure to note the start and end date to ensure you access the desired dataset. 3) Check the box of the variable in the left column that you would like to include and then plot the data. For more information on choosing a type of plot, see the Giovanni User Manual.
Image
 Select a map plot type. 2) Select a date range. Data are in multiple temporal resolutions, so be sure to note the start and end date to ensure you access the desired dataset. 3) Check the box of the variable in the left column that you'd like to include and then plot the data.")
Giovanni interface with three steps highlighted: 1) Select a map plot type. 2) Select a date range. Data are in multiple temporal resolutions, so be sure to note the start and end date to ensure you access the desired dataset. 3) Check the box of the variable in the left column that you'd like to include and then plot the data.
- MODIS NDVI in Giovanni
Data can be downloaded as GeoTIFF.
Data can be visualized in Worldview:
- MODIS NDVI
This dataset has a spatial resolution of 250 m and a temporal resolution of eight days. 16-day and monthly data are also available within Worldview. - MODIS EVI
This dataset is monthly at 1 km spatial resolution. Rolling 8-day and 16-day data are also available within Worldview.
For more information on interpreting phenology using remote sensing data, view ARSET's Understanding Phenology with Remote Sensing training.
NASA's Socioeconomic Data and Applications Center (SEDAC) provides numerous datasets that can aid in assessing urban environments. These datasets include global urban extent, global man-made impervious surfaces, development threat maps based on combining resources land use and informal settlements, urban expansion, nightlight changes, cumulative measures of the human modification of terrestrial lands, and many more.
- Population data from Earthdata Search
- Population data from SEDAC
- Population imagery in Worldview
- Urban-related Socioeconomic data from Earthdata Search
- Urban-related Socioeconomic data at SEDAC
- Urban-related Socioeconomic imagery in Worldview
SEDAC's POPGRID Viewer enables direct comparison of different population datasets based on different data sources and methodologies. The tool incorporates a four-panel display of six different data sets: the Gridded Population of the World (GPWv4.10) 2015 count developed by SEDAC; Landscan 2015 developed by the Oak Ridge National Laboratory; WorldPop Estimates 2014 from the WorldPop project; Global Human Settlement Population Grid 2015 (GHS-POP) developed by the European Commission's Joint Research Centre and the Center for International Earth Science Information Network (CIESIN); the Esri World Population Estimate 2016 (WPE); and the High Resolution Settlement Layer (HRSL) developed by the Facebook Connectivity Lab and CIESIN.
In addition to the datasets archived at SEDAC, several datasets available through ORNL DAAC also could be used to assess human impact on urban environments, including:
- NACP: Urban Greenhouse Gases across the CO2 Urban Synthesis and Analysis Network
- DARTE Annual On-road CO2 Emissions on a 1-km Grid, Conterminous USA, V2, 1980-2017
- CMS: Atmospheric Methane Concentrations and Prior Emissions, Boston, MA, 2012-2014
GIS-ready: Datasets at SEDAC are available in several file formats, including GeoTIFF. In addition, many of these datasets are available through human dimensions geospatial services.
Image
 satellite. The data were acquired over nine days in April 2012 and thirteen days in October 2012.")
The VIIRS Day/Night Band (DNB) shows Earth's surface and atmosphere using a sensor designed to capture low-light emission sources under varying illumination conditions. DNB imagery is useful for assessing power outages across wide areas.
NASA also developed the Black Marble, a daily calibrated, corrected, and validated product suite, so nightlight data can be used effectively for scientific observations. Black Marble's standard science processing removes cloud-contaminated pixels and corrects for atmospheric, terrain, vegetation, snow, lunar, and stray light effects on the VIIRS DNB radiances. Black Marble data can be accessed at NASA's Level-1 and Atmosphere Archive and Distribution System DAAC (LAADS DAAC). Black Marble imagery in Worldview is an image composite that was assembled from clear, cloud-free images acquired in 2012 and 2016.
For more information on the VIIRS DNB and Black Marble products, read the Nighttime Lights Backgrounder.
Image

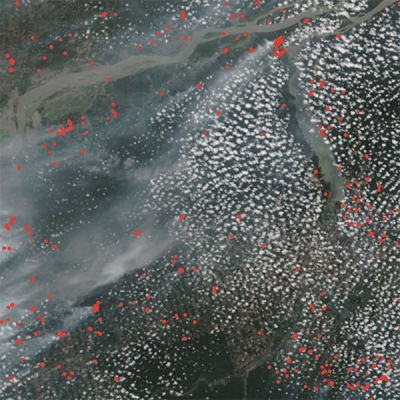
Air pollution kills an estimated seven million people every year, making it one of the biggest environmental health risks, according to the U.N. Poor air quality is exacerbated in low- to middle-income countries, where 98% of urban centers with a population of more than 100,000 people do not meet World Health Organization guidelines.
Air pollution is caused by both anthropogenic and natural events, including cookstoves, coal-fired power plants, vehicle emissions, as well as wildfires and dust storms. NASA Earth observing data help air quality managers and public health researchers monitor air pollutants locally, regionally, and globally to further determine the risk for health conditions or diseases that are exacerbated by poor air quality and the locations that might be impacted.
Aerosol Optical Depth and PM2.5
Image

Aerosol Optical Depth (AOD) is the measure of aerosols (from dust, haze, smoke, pollution, etc.) distributed within a column of air, and is a key measurement for tracking annual mean levels of fine particulate matter (abbreviated PM) in cities. Particulate matter is a mixture of particles suspended in the air and is defined based on the diameter of the particles: those that are equal to or less than 2.5 micrometers (PM2.5), which is more than 100 times thinner than a human hair, or those that are between 2.5-10 micrometers (PM10). PM2.5 is significant because these small particles stay suspended in the air longer. AOD is based on the fact that these suspended particles change the way the atmosphere reflects and absorbs visible and infrared light.
AOD does not equate to PM2.5. However, the two measurements correlate, and there are several different techniques to convert AOD to PM2.5. It is important to note that while there is a relationship between AOD and PM2.5, there are other factors which can affect AOD, like humidity, the vertical distribution of aerosols, and the shape of the particles.
ARSET has a Jupyter Notebook that accesses VIIRS AOD data and converts AOD to PM2.5 available through the ARSET GitHub site. For more information on using this notebook, view the MODIS to VIIRS Transition for Air Quality Applications.
Image

AOD is a column-integrated value of aerosols in the atmosphere obtained by measuring the scattering and absorption of solar energy from the top of the atmosphere to the surface. The non-aerosol signal of surface reflectance needs to be separated from the aerosol signal to accurately obtain AOD. This is challenging because the satellite instrument cannot penetrate cloud cover and highly reflective surfaces, such as ice or snow. This can lead to misrepresentations of the data. Scientists have developed the Dark Target and Deep Blue algorithms for MODIS data to help account for these effects. In the latest dataset collection (MODIS Version 6.1), these two have been merged, using the highest quality for each. While it does provide the easiest use of global coverage, there are still uncertainties in cloudy, snow-covered or ice-covered scenes, and areas of water with strong sun glint.
Along with MODIS, VIIRS also collects AOD data at a much finer spatial resolution. VIIRS uses the Deep Blue Algorithm over land and the Satellite Ocean Aerosol Retrieval (SOAR) algorithm over water to determine atmospheric aerosol loading for daytime cloud-free, snow-free scenes. With the VIIRS data, each NetCDF file includes three relevant AOD data products: AOD estimated at 550 nm over land, over ocean, and over land and ocean. As with all remote sensing data, make sure you are choosing the best product for your area.
The Multi-angle Imaging Spectroradiometer on the Terra spacecraft collects AOD at 550 nm, as well as provides the AOD fraction due to nonspherical aerosols and the fraction due to small mode aerosols (radius less than 0.35 micrometers), medium mode aerosols (radius 0.25-0.7 micrometers), and large mode aerosols (radius greater than 0.7 micrometers).
Research quality data products can be accessed via Earthdata Search. Data are in HDF or NetCDF format and can be opened using a free NASA data viewer called Panoply:
- MODIS/Aqua AOD (3 km resolution, merged algorithm)
- MODIS/Terra AOD (3 km resolution, merged algorithm)
- MODIS Terra/Aqua-MAIAC Retrieval AOD
Multi-angle Implementation of Atmospheric Correction (MAIAC) Land AOD utilizes a new advanced algorithm which uses time series (TMS) analysis and a combination of pixel- and image-based processing to improve the accuracy of cloud detection, aerosol retrievals, and atmospheric correction. - VIIRS AOD at 1 degree x 1 degree (daily global data coverage)
- VIIRS AOD at 6 km (daily)
- Monthly VIIRS AOD at 1 degree x 1 degree
- Multi-angle Imaging SpectroRadiometer (MISR) AOD
Visualizing AOD Imagery Using Giovanni
Data products can be visualized as a time-averaged map, an animation, seasonal maps, scatter plots, or a time series using the Giovanni web application at GES DISC. Giovanni is a web-based application that provides a simple and intuitive way to visualize, analyze, and access vast amounts of Earth science remote sensing data without having to download the data (although data downloads are also supported).
Image
Follow these steps to plot data in Giovanni: 1) Select a map plot type (for more information on choosing a type of plot, see the Giovanni User Manual). 2) Select a date range. Data are in multiple temporal resolutions, so be sure to note the start and end date to ensure you access the desired dataset. 3) Check the box of the variable in the left column that you'd like to include and then plot the data.
- OMI AOD in Giovanni
The Ozone Monitoring Instrument (OMI) on the multi-national NASA Aura Earth observing satellite (launched in 2004) has a coarser spatial resolution than MODIS and VIIRS, but provides data at individual wavelengths from the ultraviolet (UV) to the visible. Using Giovanni, you can plot daily data at these individual wavelengths. This is important because pollutants have different spectral signatures. For example, a wavelength range around 400 nm can be used to detect elevated layers of absorbing aerosols such as biomass burning and desert dust plumes. The two AOD products provided through Giovanni use two different algorithms - OMI Multi-wavelength (OMAERO) and OMI UV (OMAERUV). OMAERO is based on the multi-wavelength algorithm and uses up to 20 wavelength bands between 331 nm and 500 nm. This algorithm uses reflectances for a wide variety of microphysical aerosol models representative of desert dust, biomass burning, volcanic ash, and weakly absorbing aerosol types. OMAERUV uses the near-UV algorithm, which is capable of retrieving aerosol properties over a wider variety of land surfaces than is possible using measurements only in the visible or near-IR, because the reflectance of all terrestrial surfaces (not covered with snow) is small in the UV. - MODIS AOD in Giovanni
Provides data products with both the Dark Target and Deep Blue algorithms, as well as the combined Dark Target/Deep Blue algorithm at daily and monthly intervals. - MISR AOD in Giovanni
There are two data products available in Giovanni, the MISR level 3 global aerosol product covering a day (MIL3DAE) and covering a month (MIL3MAE).
Near Real-Time AOD Imagery
Near real-time AOD imagery can be interactively explored and downloaded using NASA Worldview:
- MODIS Aqua/Terra Combined Algorithm AOD
The merged Dark Target/Deep Blue AOD layer provides a more global, synoptic view of AOD over land and ocean. It is available from 2000 to present. - VIIRS Level 2 Deep Blue Aerosol Product
This product uses the Deep Blue algorithm over land and the SOAR algorithm over water to determine atmospheric aerosol loading. It is designed to facilitate continuity in the aerosol record. Deep Blue uses measurements from multiple Earth observing satellites to determine the concentration of atmospheric aerosols along with the properties of these aerosols. - OMI AOD Multi-wavelength and UV Absorbing and Extinction Layers
The multi-wavelength layer and the UV absorbing layer display the degree to which aerosols prevent the transmission of light through the process of absorption (attenuation). The UV extinction layer indicates the level at which aerosols prevent light from traveling through the atmosphere. Toggling between these three can provide more distinction on the types of aerosols present. - MISR AOD in Worldview
Imagery layer displays the temporal averages of all aerosol optical depths calculated from radiances acquired from the green band (555 nm) of MISR's cameras over a particular month.
Image
")
Aerosol Index (AI) is a measurement related to AOD and indicates the presence of an increased amount of aerosols in the atmosphere. The main aerosol types that cause signals detected in this value are desert dust, significant fire events, biomass burning, and volcanic ash plumes. The lower the AI, the clearer the sky.
In addition to OMI, both the TROPOspheric Monitoring Instrument (TROPOMI) aboard Sentinel 5 - an ESA Mission - and the Ozone Mapping and Profiling Suite (OMPS) Nadir-Mapper (NM) sensor, aboard the Suomi NPP satellite, measure AI.
Research quality data products can be accessed via Earthdata Search.
- OMI AI from Earthdata Search
OMI provides an Ultraviolet Aerosol Index; data are in HDF5 format and can be opened using Panoply. Note that when opening the data in Panoply, there are a number of different data fields from which to choose. Select UVAerosolIndex. - TROPOMI AI data from Earthdata Search
ESA TROPOMI AI provides additional information on this level 2 data product. Data are NetCDF format and can be opened using Panoply.
Visualizing AI Imagery Using Giovanni
Data products can be visualized as a time-averaged map, an animation, seasonal maps, scatter plots, or a time series through an online interactive tool, Giovanni. Follow these steps to plot data in Giovanni: 1) Select a map plot type; for more information on choosing a type of plot, see the Giovanni User Manual. 2) Select a date range. Data are in multiple temporal resolutions, so be sure to note the start and end date to ensure you access the desired dataset. 3) Check the box of the variable in the left column that you'd like to include and then plot the data.
Near Real-Time AI Imagery
NRT data can be accessed via Worldview:
- OMI AI data in Worldview
- OMPS AI data in Worldview
OMPS Aerosol Index layer indicates the presence of ultraviolet (UV)-absorbing particles in the air.
Additional Air Quality Resources
NASA's Atmospheric Science Data Center (ASDC) has several tools for browsing and subsetting data from the Multi-angle Imaging SpectroRadiometer (MISR) instrument aboard NASA's Terra satellite. MISR views Earth with cameras pointed at nine different angles. As the instrument flies overhead, regions of Earth's surface are successively imaged by all nine cameras in each of four wavelengths (blue, green, red, and near-infrared). MISR data can distinguish different types of clouds, aerosol particles, and surfaces. Specifically, MISR monitors the monthly, seasonal, and long-term trends in the amount and type of atmospheric aerosol particles, including those formed by natural sources and by human activities; the amount, types, and heights of clouds; and the distribution of land surface cover, including vegetation canopy structure.
ASDC's MISR Browse Tool allows easy access to images from the MISR instrument. The browse images are ellipsoid color images for each camera and are available at two different resolutions. The MISR Order and Customization Tool provides users with ability to select and order MISR data by date, time, and geolocation.
GIS-ready: AOD data are available through atmosphere-related geospatial services. ASDC also provides visualization and data access for monthly MISR global AOD within an ArcGIS server.
Image
 of mineral dust and sea-salt filtered fine particulate matter of 2.5 micrometers or smaller (PM2.5) as visualized in Worldview. Credit: NASA")
Air quality-related deaths and diseases that are exacerbated by air pollution are preventable, but prevention requires a knowledge of where vulnerable populations exist and the interventions that are needed in these communities. Observations of airborne particulate matter, along with socioeconomic data, can help do just that.
SEDAC provides a number of datasets on population exposure and vulnerability:
- Global Population Projection Grid Data
- Poverty-related Data
- Global Annual PM2.5 Grids (Note: An updated version of this dataset is expected to be available shortly through SEDAC)
GIS-ready: Datasets at SEDAC are available in several file formats, including GeoTIFF. In addition, many of these datasets are available through human dimensions geospatial services.