
Brazilian Wildfires Captured by NASA TROPESS

The NASA TRopospheric Ozone and Precursors from Earth System Sounding (TROPESS) project captures trace-gas emissions associated with the August 2022 Amazon fires.

Introduction

The Amazon rainforest in Brazil experiences an annual burning season during August-September due to rain abatement. In September 2022, a record number of over 75,500 active fires had been reported to the National Institute for Space Research in São Paulo, surpassing the total reported in all of 2021.

The NASA TRopospheric Ozone and Precursors from Earth System Sounding (TROPESS) project captured Carbon Monoxide (CO), Ammonia (NH3) and Peroxyacetyl Nitrate (PAN) emissions associated with the burning that took place in the region during August 2022.

Spatial Coverage

Amazon Basin, Brazil 

Time Range

August 2022

August 2022 Meteorological Background of Brazil

Brazil’s annual dry season typically occurs from August through September. However, regional precipitation is driven by a variety of competing factors. Teleconnections typically associated with La Niña (negative El Niño - Southern Oscillation (ENSO) indices) lead to wetter-than-normal conditions in northern Brazil and anomalously drier conditions in southern Brazil.

Simultaneously, the Intertropical Convergence Zone (ITCZ) and its associated rainfall migrates deeper into the Northern Hemisphere (Figure 1 left) — hence, farther from Brazil due to increased summertime solar heating in the Northern Hemisphere. Locally, residual moisture within the tropical biome of the Amazon rainforest still allows for positive feedback within its local hydrological cycle. 

In August of 2022, the outcome of all controlling factors is seen as slightly increased recurrence of days with heaviest 10% precipitation (Figure 1 right), and corresponding wet anomalies (on average more precipitation) as compared to the base period of 2000-2021. These same locations appear to coincide with suspected fire activity along the western and southern border of Brazil, Carbon Monoxide. These results seem to be at odds with Albrecht (1989), where it is suggested that higher aerosol concentrations (in this case from biomass burning) may lead to delayed rainfall. However, it is also speculated that the delayed rainfall is heavier. Hence, this uncertainty demonstrates the importance of data continuity to have a large variation of events enabling resolution of the driving factors of precipitation (and latent heat release) in such complex situations. It is also worth noting that while there is some apparent anomalous rainfall in much of the Amazon rainforest and neighboring states, there is also some evidence of drying in localized areas within northern Brazil (see Figure 1 right). 

Image
Image Caption

Figure 1. Integrated Multi-satellitE Retrievals for Global Precipitation Measurement (IMERG) Late precipitation anomalies expressed as departures from the climatological mean (base period 2000-2021) for South America during August 2022. (Left) anomaly; (right) change in frequency of the extreme 10% days.

Image

Atmospheric Infrared Sounder (AIRS) temperature anomalies shown in Figure 2 indicate cooling along the western edge of Brazil. The increased recurrence of coldest 10% days (Figure 2 left) near the fire area suggest light-reflecting smoke aerosols likely played a role in cooling by blocking incoming solar radiation during the daytime. Conversely, at night (in the same location) as shown in the increased recurrence of coldest 10% of nights (Figure 2 right), anomalously low amounts of water vapor in the atmospheric column are linked to the dry season, which likely caused significant radiative cooling within the region.

Image
Image Caption

Figure 2. The change in frequency of occurence of coldest (left) daytime and (right) nighttime temperature anomalies calculated using AIRS retrievals. The base period of AIRS observations starts in September, 2002, the first full month of good quality AIRS data.

Both Modern-Era Retrospective analysis for Research and Applications Version 2 (MERRA-2) surface pressure anomaly maps, Figure 3, depict minimal departures from the norm during August 2022 for much of the fire area in western and southern Brazil.

Image
Image Caption

Figure 3. MERRA-2 model captures (left) surface pressure anomalies (right) median surface pressure as percentiles of climatology over the continent of South America during August 2022. The base period for MERRA-2 data begins in January 2000.


Image

Smoke and Trace Gas Signals over the Fires

In August 2022, large areas of suspected biomass burning appeared on satellite imagery (Figure 4). Figure 4 (left) shows smoke in Pará, Brazil being advected west on August 13, 2022. The orange spots are Fire and Thermal anomalies from Terra/Moderate Resolution Imaging Spectroradiometer (MODIS) Day and Night observations. Figure 4 (right) image depicts smoke from fires near the Brazil, Bolivia, Paraguay border on September 1, 2022. Red areas are Fire and Thermal anomalies from NOAA-20/Visible Infrared Radiometer Suite (VIIRS) Day and Night observations. Both of these images were acquired from NASA Worldview

Image
Image Caption

Figure 4. MODIS and VIIRS views of Brazilian wildfire smoke acquired from NASA Worldview. (Left) Smoke in Pará, Brazil being advected west on August 13, 2022. (Right) Smoke from fires near the Brazil-Bolivia-Paraguay border on September 1, 2022.


Image

Over the course of several months, various parts of Brazil detected pollutants associated with wildfire activity. The GIF imagery (Figure 5) below identifies the presence of Carbon Monoxide, Ammonia, and Peroxyacetyl nitrate within the atmospheric column above Brazil and neighboring areas during June-December 2022. Given the distribution of these species as depicted in these images, it appears that the majority of the suspected fire area was mostly concentrated in western and southern Brazil. 

This animation shows retrievals of carbon monoxide in Brazil.
This is an animation of ammonia over northern South America.
This is an animation of peroxyacetyl nitrate using TROPESS data over northern South America.
Caption

Figure 5. Retrievals of (top) Carbon Monoxide (CO), (middle) Ammonia (NH3), and (bottom) Peroxyacetyl nitrate (PAN) using TROPESS Cross-track Infrared Sounder - Joint Polar-orbiting Satellite System (CrIS-JPSS1) L2 Forward Stream, Summary Product V1 data, June 20-December 5, 2022.


The animations below are animated GIF timelapse images for August 2022 for the same TROPESS data variables. Figure 6 displays Carbon Monoxide (XCO) data. Figure 7 displays Ammonia (NH3) data. Figure 8 displays Peroxyacetyl nitrate (PAN) data. 

Note: NOAA-20 and JPSS1 are the same satellite; the satellite is named JPSS1 prior to launch and NOAA-20 after launch and transfer of operations to NOAA. The dataset name used the JPSS1 satellite designation.

This is an animation from TROPESS showing a timelapse of wildfires in Brazil.
Caption

Figure 6. Timelapse GIF image of TROPESS Carbon Monoxide retrievals August 2022. Courtesy of Valentin Kantchev, SSG.

This is a timelapse from August 1, 2022 to August 31, 2022 of wildfires in Brazil.
Caption

Figure 7. Timelapse GIF image of TROPESS Ammonia retrievals August 2022. Courtesy of Valentin Kantchev, SSG.

This is a timelapse of TROPESS Peroxyacetyl nitrate retrievals in August 2022
Caption

Figure 8. Timelapse GIF image of TROPESS Peroxyacetyl nitrate retrievals August 2022. Courtesy of Valentin Kantchev, SSG.

References

Albrecht, B.A., 1989: Aerosols, Cloud Microphysics, and Fractional Cloudiness, Science245, 1227-1230, 10.1126/science.245.4923.1227.

AIRS project (2019), Aqua/AIRS L3 Daily Standard Physical Retrieval (AIRS-only) 1 degree x 1 degree V7.0, Greenbelt, MD, USA, Goddard Earth Sciences Data and Information Services Center (GES DISC), 10.5067/UO3Q64CTTS1U

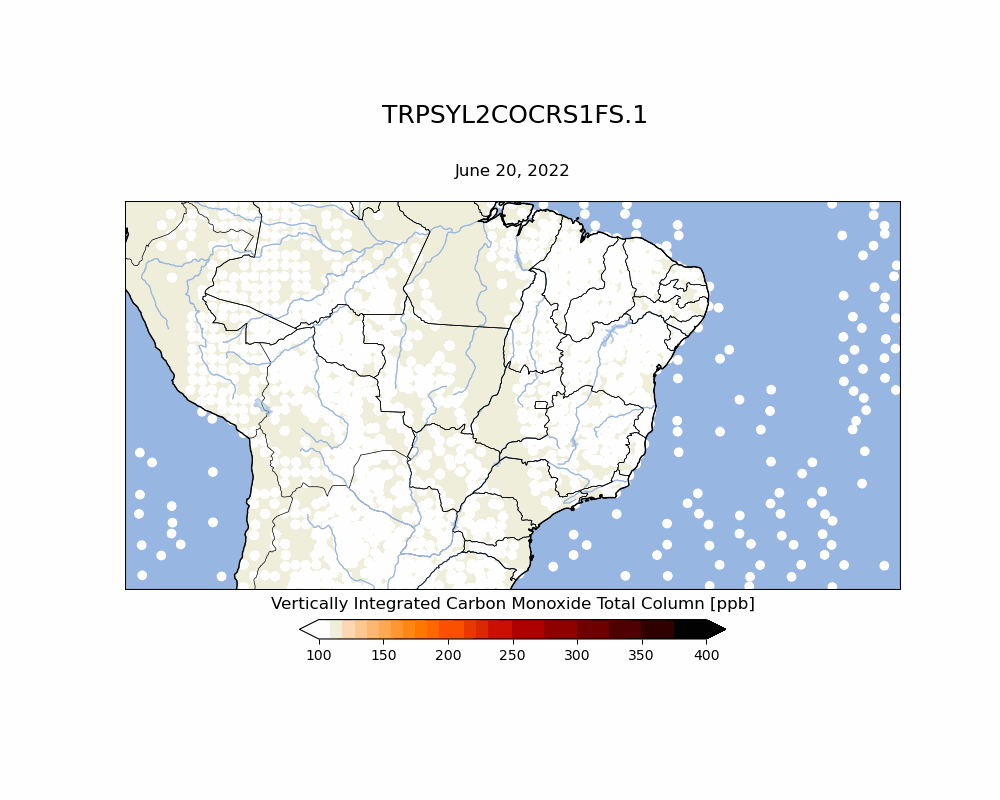
Bowman, K.W., 2022: TROPESS CrIS-JPSS1 L2 Carbon Monoxide for Forward Stream, Summary Product, Version 1. Goddard Earth Sciences Data and Information Services Center (GES DISC), Greenbelt, MD, USA, accessed 13 June 2023, 10.5067/JL1HT3NGEAW3

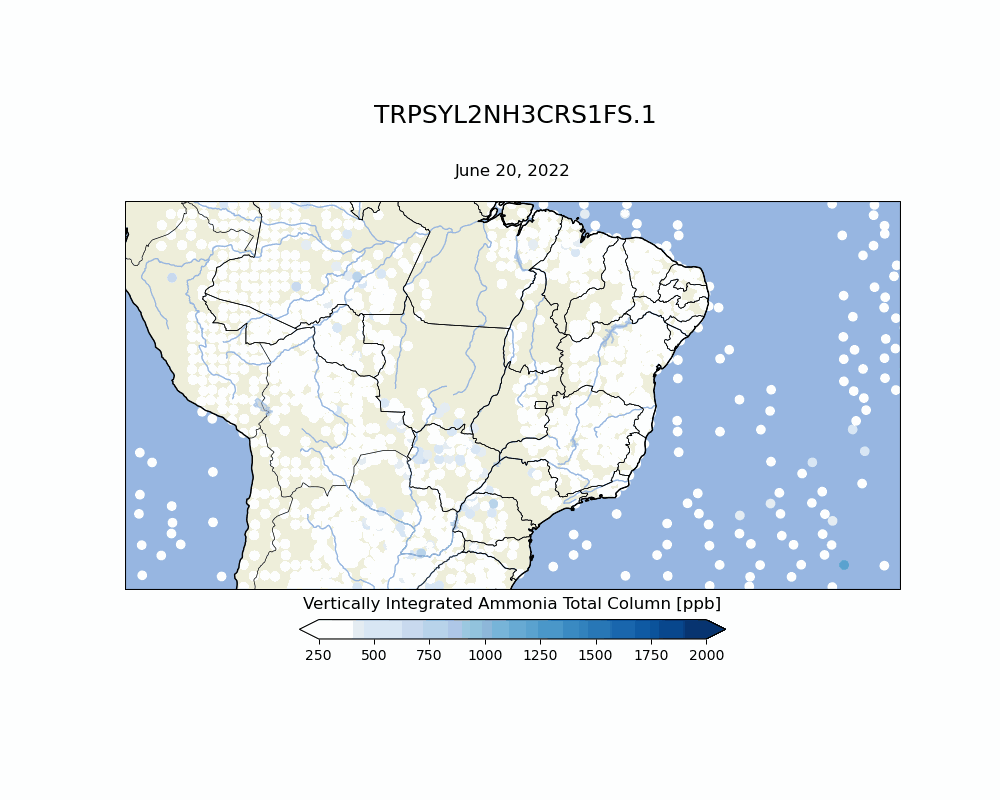
Bowman, K.W., 2022: TROPESS CrIS-JPSS1 L2 Ammonia for Forward Stream, Summary Product, Version 1. Goddard Earth Sciences Data and Information Services Center (GES DISC), Greenbelt, MD, USA, accessed 13 June 2023, 10.5067/2Q7XUY6OTKY1

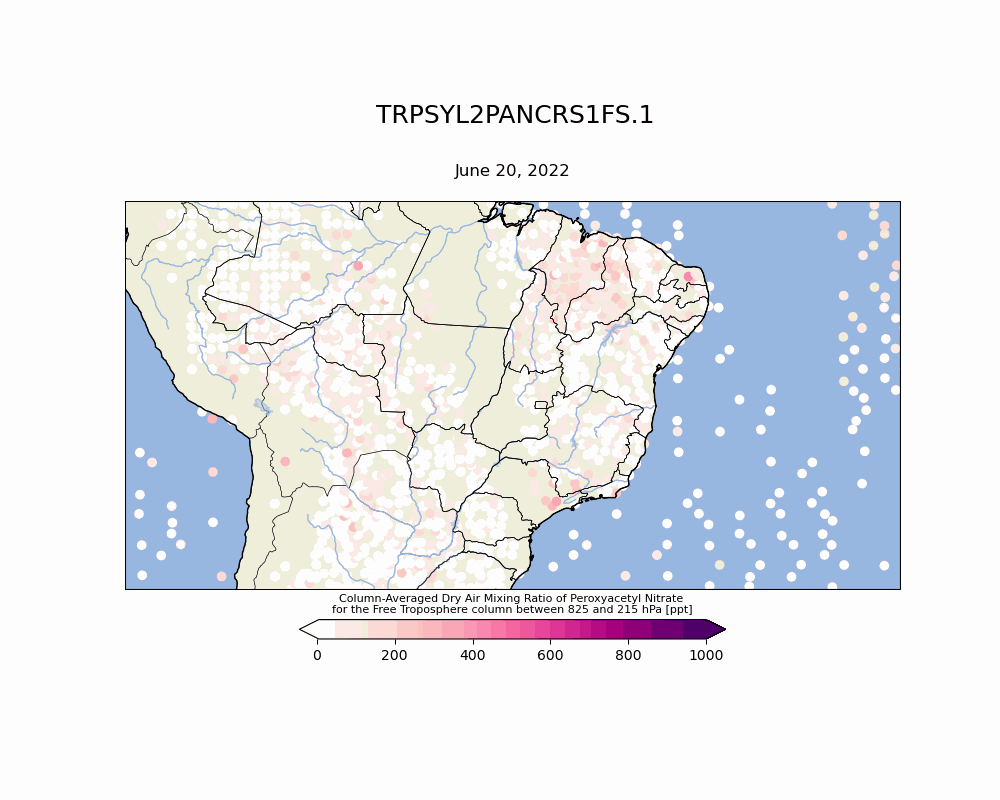
Bowman, K.W., 2022: TROPESS CrIS-JPSS1 L2 Peroxyacetyl Nitrate for Forward Stream, Summary Product, Version 1. Goddard Earth Sciences Data and Information Services Center (GES DISC), Greenbelt, MD, USA, accessed 13 June 2023, 10.5067/6HTQB4F81S08.

Global Forest Watch: Brazil Deforestation Rates and Statistics. Accessed 14 June 2023, https://www.globalforestwatch.org/dashboards/...showMap=true.

Global Modeling and Assimilation Office (GMAO) (2015), MERRA-2 tavg1_2d_slv_Nx: 2d,1-Hourly,Time-Averaged,Single-Level,Assimilation,Single-Level Diagnostics V5.12.4, Greenbelt, MD, USA, Goddard Earth Sciences Data and Information Services Center (GES DISC), 10.5067/VJAFPLI1CSIV

Huffman, G.J., E.F. Stocker, D.T. Bolvin, E.J. Nelkin, Jackson Tan (2019), GPM IMERG Late Precipitation L3 1 day 0.1 degree x 0.1 degree V06, Edited by Andrey Savtchenko, Greenbelt, MD, Goddard Earth Sciences Data and Information Services Center (GES DISC), 10.5067/GPM/IMERGDL/DAY/06

Details

Last Updated

June 4, 2026

Published

March 27, 2026