Connecting Rainfall and Landslides

Scientists use satellites to plot heavy rainfall and help assess landslide and flood hazards.

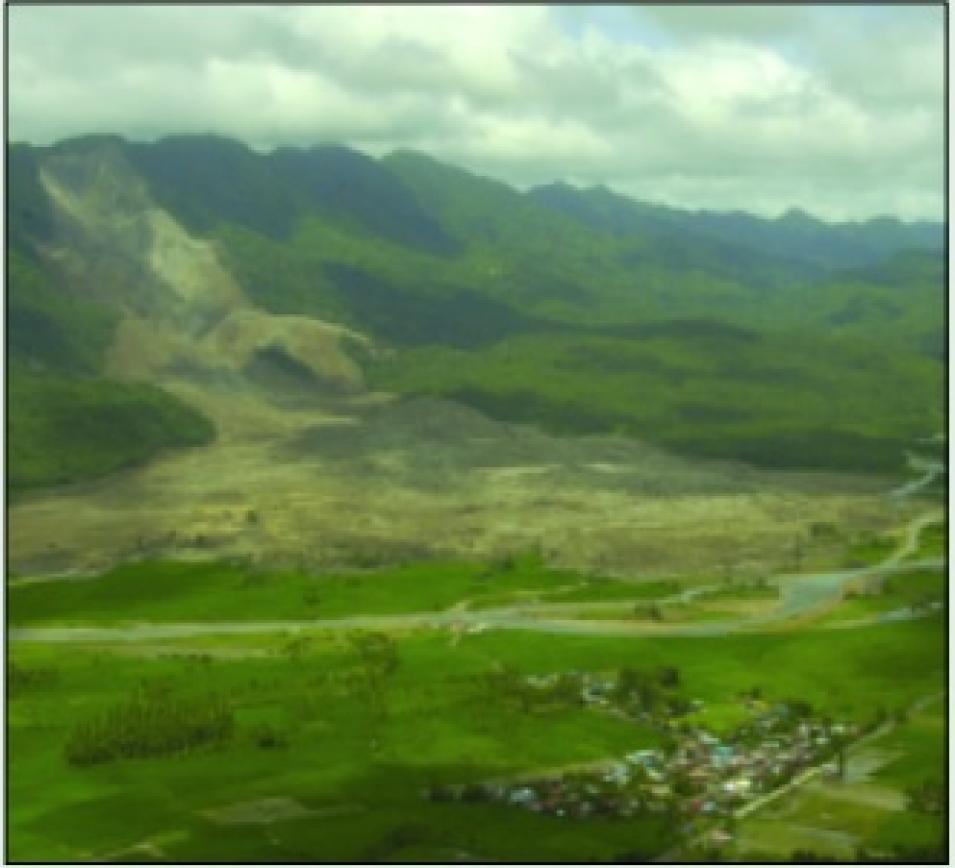
On February 17, 2006, the Philippine village of Guinsaugon disappeared. A massive landslide swallowed more than 350 houses and an elementary school, burying more than 1,100 people. Residents of the village, situated at the foot of a mountain on Leyte Island, had no warning and no time to evacuate. While there was no direct trigger for the Guinsaugon landslide, experts and officials explored several causes, including several days of unusually heavy rainfall that had saturated the mountainside prior to the slide.

While rainfall-induced landslides can happen within minutes, the wet conditions that precede them can take several hours or days to develop. But many countries in high-risk areas lack the resources to maintain the extensive weather networks required to successfully observe these conditions. Robert Adler, a senior scientist in the NASA Laboratory for Atmospheres at Goddard Space Flight Center, and Yang Hong, a research scientist at NASA's Goddard Earth Sciences and Technology Center (GEST), approached the problem from space. A reliable satellite-based system would help minimize the challenge of maintaining local systems, especially in regions where heavy rains and flooding often wash away ground-based instruments. Adler and Hong are merging data from an array of satellites to determine whether remote sensing instruments can indicate where rainfall-induced landslides might occur. Adler said, “If we can complete this research and make the results available on the Web, then almost any government or organization in the world can access this information.”
Guinsaugon landslide
Image Caption

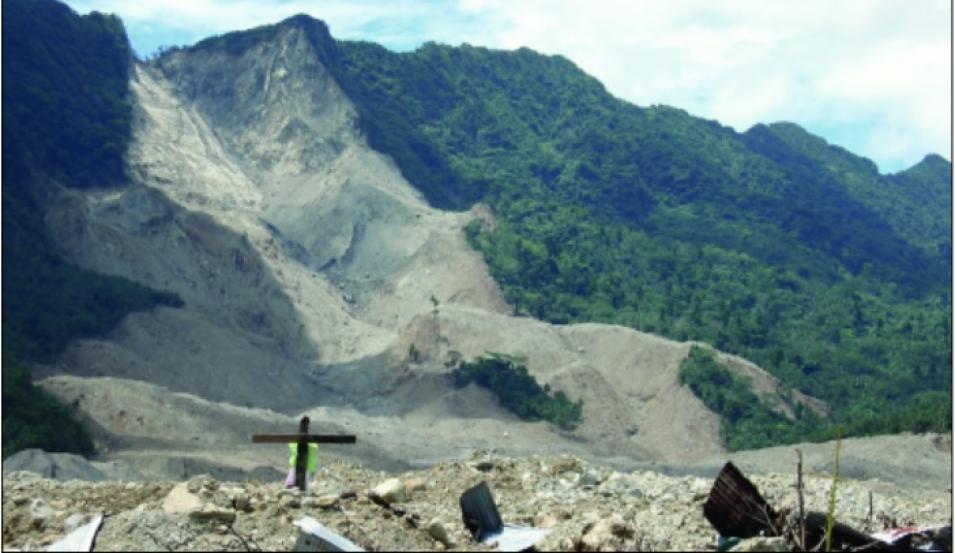
Debris from the February 17, 2006, landslide that buried Guinsaugon shows the effect of tectonic weakening. The landslide occurred along a fault line, where tectonic movement grinds and crushes the rock. This ground-up rock and soil on the mountainside had become more prone to landslides, especially after several days of rain. (Courtesy Stephen Evans)

Mapping landslide susceptibility

Rainfall is the key factor in Adler and Hong’s study, but first the scientists needed to determine which areas were most prone to landslides. The first step was to piece together a global landslide susceptibility map, which would help reveal terrain and ground properties. Hong said, “Rainfall can be a trigger for landslides, but ground conditions are also very important.” The researchers needed to account for a range of factors, including terrain, soil type, and land-cover characteristics. However, there was no single source for the data they required. “In order to look at landslide susceptibility, we needed multiple data sources,” Hong said.

To compile the map, Adler and Hong used digital elevation models to establish terrain and slope, as well as flow path and direction for rivers and water runoff. Satellite data helped the researchers determine land-cover types, including forests, grasslands, wetlands, deserts, and urban areas. Adler and Hong relied on a soil properties map to distinguish global soil composition and depth.

The map revealed no surprises—the researchers already had a general idea which regions of the world were susceptible to landslides. But the map did provide a solid basis against which to compare rainfall data, and illuminated areas that exhibited the key ingredients for a landslide. “The most important factors are the slope and soil type. Steep slopes and coarse soil types are more susceptible to landslides,” Hong said. “And, in terms of land cover, bare soil contributes more to landslides.”

Landslides occur everywhere in the world, but the danger of rainfall-induced slides tends to be much greater in tropical mountainous regions like those in the Philippines, Central and South America, and southeastern Asia. Steep terrain, combined with the heavy rains brought by monsoon seasons, hurricanes, and typhoons puts dense populations at risk.

global landslide susceptibility
Image Caption

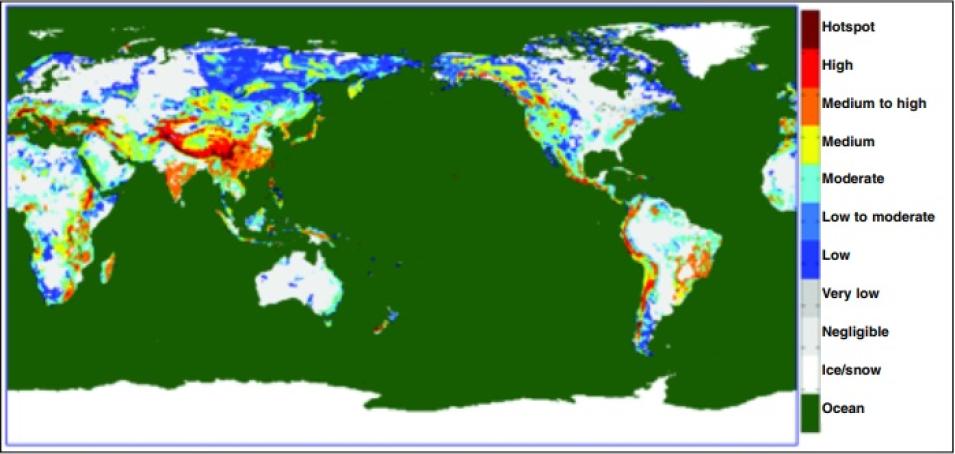
This global landslide susceptibility map uses red and orange to indicate hot spots in potential landslide regions. Hotspots often occur in mountainous areas, such as the Himalayas and Andes, and in areas susceptible to heavy monsoon rains, such as southern Asia and parts of South America. (Courtesy Robert Adler and Yang Hong)

Remotely sensing rainfall

To analyze global rainfall, Adler and Hong required multiple data sources from a variety of satellites. Their primary source of rain data, however, was the NASA Tropical Rainfall Measuring Mission (TRMM), obtained from NASA's Goddard Earth Sciences Data and Information Services Center (GES DISC).

Adler said, “There are two main things that TRMM provides for this multi-satellite analysis. One, it’s the calibrator for the information from the other satellites. Two, it’s always in the tropics, and gives us very good coverage in a critical area.” Launched in 1997, the TRMM satellite was specifically designed to observe tropical rainfall and storm characteristics. TRMM orbits the Earth from west to east along the equator, weaving between 35 degrees north and 35 degrees south. Several of the other satellites from which Adler and Hong collect data are in polar orbits that travel north to south, passing near or over the north and south poles during each orbit and crossing the equator during each pass. “Because the TRMM orbit crosses over the paths of each polar-orbiting satellite, we’re able to collect subsets of data from both satellites at the same time,” Adler said. “We use TRMM data, which we think is making the best estimate, to calibrate, or adjust the rain estimates from the other satellites.” Calibrating the satellites helped correct errors and eliminate inconsistencies, allowing scientists to obtain the most precise rainfall measurements.

To verify the correlation they observed, Adler and Hong identified seventy-four rainfall-induced landslides that occurred between the TRMM launch and 2006, including the Guinsaugon slide. They plugged archived rainfall data into an equation that incorporated rainfall intensity and duration to determine a “threshold” for each of the landslides. Adler and Hong’s satellite-deduced results closely matched previous rainfall-gauge-based threshold estimates, confirming that extremely intense rainfall overwhelmed the thresholds for each of the sites and triggered the slides, particularly when the heaviest rain fell in a short duration of less than twelve hours. Their findings demonstrated that a satellite-based approach could successfully indicate potential landslide conditions.

Guinsaugon aerial landslide
Image Caption

This aerial view shows the landslide that destroyed the town of Guinsaugon on February 17, 2006. (Courtesy U.S. Navy by Photographer’s Mate 1st Class Michael D. Kennedy)

Experimental development

Adler and Hong’s research contributed to the development of the TRMM Real-Time Multi-Satellite Precipitation Analysis (TMPA-RT) product. The TMPA-RT data, currently available online from 2002 through the present, are updated in real time, allowing users to determine if an area is currently receiving particularly intense rainfall or has reached a critical level of accumulation. However, Adler and Hong stress that the product is still experimental. Adler said, “This is a very new approach. We certainly need to do a substantial amount of evaluation to understand the product’s potential, and also its limitations.”

Even in its experimental status, researchers and agencies are using the TMPA-RT system to assess landslide and flood hazards. For instance, the Mekong River Commission, a partner in the Asia Flood Network, began downloading TMPA-RT data in 2003 to help calculate rainfall totals for the Mekong River basins in Cambodia, Laos, Thailand, and Vietnam. Making the satellite data available helps supplement conventional ground-based rain-gauge networks that do not provide enough coverage. Hong said, “Developing countries don’t often have ground information for rainfall available, so satellite data is the only source.”

In addition, a research group at Tennessee Technological University is assessing TMPA-RT data to help gauge precipitation and flooding in more than 250 river basins worldwide. Many large river systems cross international borders, meaning that downstream countries often need to negotiate with their upstream neighbors to access critical flood hazard information. Using satellite data can be an easier and more cost effective method to observe conditions along an entire river basin, proving critical when upstream nations lack adequate information.

TMPA-RT South America
Image Caption

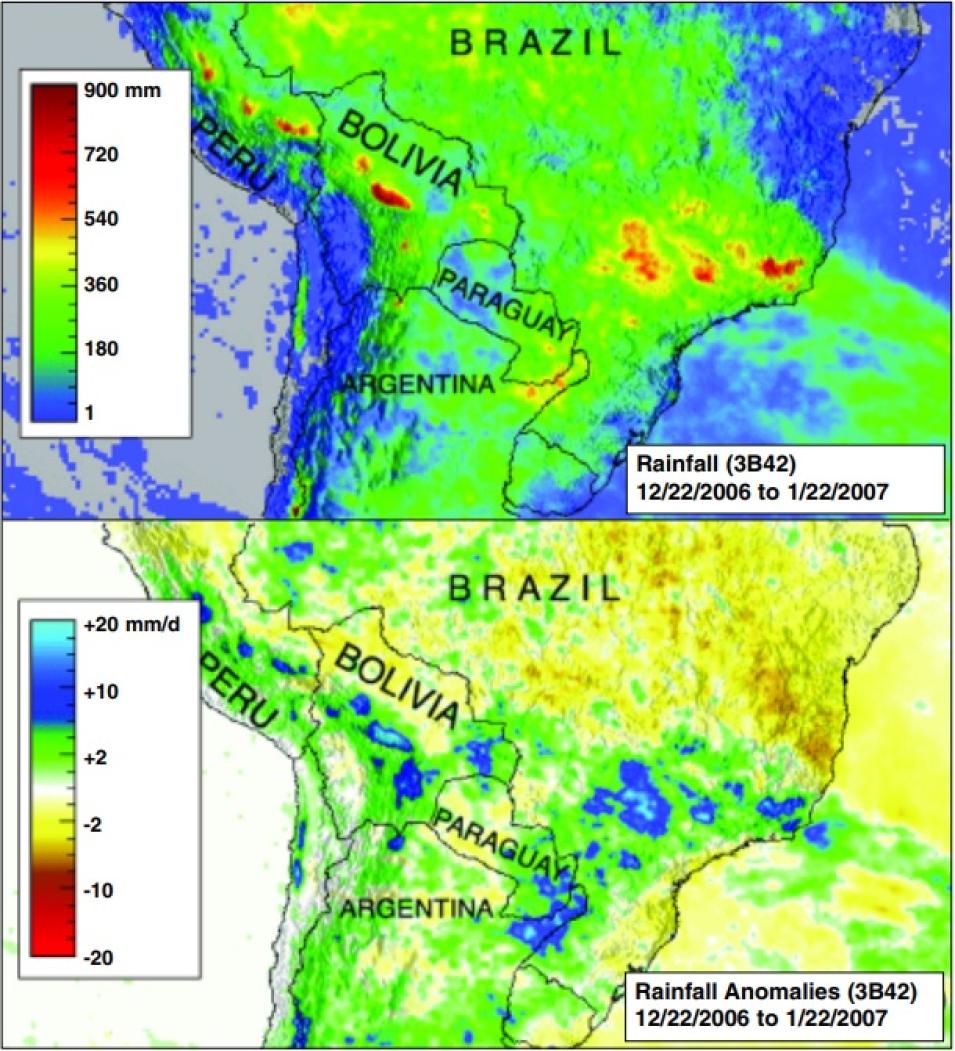
Persistent heavy rain during December 2006 and January 2007 triggered flooding and mudslides across South America, killing more than sixty people in Brazil, Bolivia, and Peru. In combination with certain types of terrain, soil conditions, and land cover, heavy rain can make certain regions vulnerable to landslides. These images incorporate data from the Tropical Rainfall Measuring Mission (TRMM) Real-Time Multi-Satellite Precipitation Analysis (TMPA-RT) product. The top image indicates rainfall in millimeters; the bottom image shows which areas received more rainfall than average for this time of year, in millimeters per day. (Courtesy Hal Pierce/SSAI/GSFC)

Future research

Adler and Hong plan to refine the TMPA-RT system to make it more useful to local governments and organizations on the ground. And for landslide-prone areas like Leyte Island, this research may ultimately save lives. As with many mountainous areas in the tropics, timely landslide hazard assessment may be difficult to accomplish without satellite data. Adler said, “This system will be valuable when national and international organizations have to plan disaster mitigation or relief work. It can give them quantitative information about where exactly the hazard is and which areas are affected. And that’s why I think that a lot of people are looking at this information. You don’t get it anywhere else.”

The online TMPA-RT data provides an easy way for people to download text files or zoom into geographic maps that display three-hour rainfall rates or seven-day accumulations. In addition, Hong is making hourly rainfall data available through Google Earth. Hong said, “We’re looking at using this product to predict landslides in an operational way. That’s the ultimate goal, and this is our first evaluation of the potential.”

References

British Broadcasting Company News. What caused the Philippines landslide? http://news.bbc.co.uk/2/hi/asia-pacific/4723770.stm. Accessed January 16, 2007.

Evans, S. G., R. H. Guthrie, N. J. Roberts, and N. F. Bishop. 2007. The disastrous 17 February 2006 rockslide-debris avalanche on Leyte Island, Philippines: a catastrophic landslide in tropical mountain terrain. Natural Hazards Earth System Science 7: 89–101.

Hong, Y., R. Adler, and G. Huffman. 2006. Evaluation of the potential of NASA multi-satellite precipitation analysis in global landslide hazard assessment. Geophysical Research Letters 33, L22402, doi:10.1029/2006GL028010.

Hong, Y., R. F. Adler, and G. J. Huffman. 2007. An experimental global monitoring system for rainfall-triggered landslides using satellite remote sensing information. IEEE Transactions on Geoscience and Remote Sensing 5(6), doi:ntrs.nasa.gov/search.jsp?R=20070017889.

Hong, Y., R. Adler, and G. Huffman. 2007. Use of satellite remote sensing data in the mapping of global landslide susceptibility. Natural Hazards 43(2): 245-256, doi:10.1007/s11069-006-9104-z.

For more information

NASA Goddard Earth Sciences Data and Information Services Center (GES DISC)

Tropical Rainforest Measuring Mission (TRMM)

Experimental Real-Time TRMM Multi-Satellite Precipitation Analysis (TMPA-RT)

About the remote sensing data
Satellite Tropical Rainforest Measuring Mission (TRMM)
Sensor TRMM Microwave Imager (TMI)
Data set Experimental Real-Time TRMM Multi-Satellite Precipitation Analysis (TMPA-RT)
Resolution 0.25 by 0.25 degrees averaged
Parameter Rainfall
DAAC NASA Goddard Earth Sciences Data and Information Services Center (GES DISC)

Adler and Hong also used NASA Shuttle Radar Topography Mission (SRTM) digital elevation models (DEMs), NASA's Moderate Resolution Imaging Spectroradiometer (MODIS) vegetation data, and soil properties from the Digital Soil Map of the World.

Details

Last Updated

Published

Data Center/Project

Goddard Earth Sciences Data and Information Services Center (GES DISC)