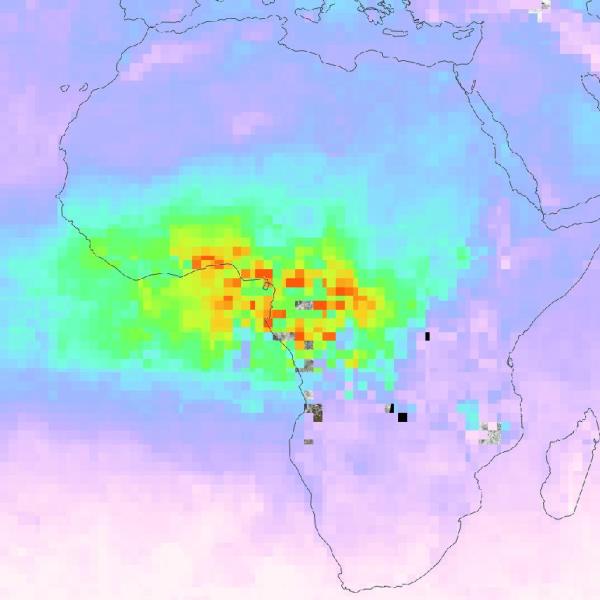
Access a range of datasets and data tools to further your atmospheric carbon monoxide research.
The atmospheric trace gas monoxide (CO) is released when something is burned, such as in the combustion of fossil fuels or biomass. Outdoor levels are rarely high enough to cause issues. When the gas does reach dangerous levels, however, it can affect people with certain types of heart disease. CO is an excellent tracer of pollution transport because it is long-lived in the atmosphere. It is also helpful for identifying the source of air masses.
Carbon monoxide from fuel use can be a major disruptor of atmospheric chemistry, inhibiting natural processes that help clean the atmosphere of pollutants. When combined with sunlight and other pollutants, carbon monoxide can also contribute to the formation of ground-level ozone and urban smog.
NASA instruments such as the Tropospheric Emission Spectrometer (TES), Tropospheric Monitoring Instrument (TROPOMI), and Microwave Limb Sounder (MLS) monitor carbon monoxide levels from Earth-observing satellites. Our carbon monoxide datasets include near real-time data as well as historical carbon monoxide levels, helping researchers conduct robust studies of air quality, pollution, and atmospheric composition.
Learn How to Use Atmospheric Carbon Monoxide Data


Join Our Community of NASA Data Users
While NASA data are openly available without restriction, an Earthdata Login is required to download data and to use some tools with full functionality.
Learn About the Benefits of Earthdata LoginFrequently Asked Questions
Earthdata Forum
Our online forum provides a space for users to browse thousands of FAQs about research needs, data, and data applications. You can also submit new questions for our experts to answer.
Submit Questions to Earthdata Forumand View Expert Responses