We are in the process of migrating all NASA Earth science data sites into Earthdata from now until end of 2026. Not all NASA Earth science data and resources will appear here until then. Thank you for your patience as we make this transition.
Read about the Web Unification Project
Atmospheric Winds Data Access and Tools
NASA’s atmospheric wind data range from hourly primary forcing measurements to inter-related suites of atmospheric wind and other data. Our datasets and tools help users find and integrate the information they need to see how this primary weather force effects our lives and planet.
Atmospheric Winds Datasets
| Dataset | Version Sort ascending | Platforms | Instruments | Temporal Extent | Spatial Extent | Spatial Resolution | Data Format |
|---|---|---|---|---|---|---|---|
| DISCOVER-AQ California Deployment Porterville Ground Site Data | 1 | GROUND STATIONS | CAPS PMex Monitor, MPL, TSI-3563 Neph, MFRSR, UC Davis RDI, SMPS, TEMPERATURE SENSORS, PRESSURE SENSORS | 2013-01-07 to 2013-02-21 | HDF5, ICARTT | ||
| SCOAPE Balloon and Ozonesondes Data | 1 | GROUND-BASED OBSERVATIONS | OZONESONDES, RADIOSONDES | 2019-05-11 to 2019-05-19 | ICARTT | ||
| GPM Ground Validation Navigation Data DC-8 OLYMPEX | 1 | NASA DC-8 | INS | 2015-11-05 to 2015-12-19 |
N: 49.3344 S: 30.3686 E: -117.797 W: -129.061 |
ASCII - XML | |
| BOREAS TF-01 SSA-OA Tower Flux, Meteorological, and Soil Temperature Data | 1 | FIXED OBSERVATION STATIONS | PYRANOMETERS, Pyrgeometer, LICOR QUANTUM SENSOR, RAIN GAUGES, SOIL HEAT FLUX TRANSDUCER, SONIC ANEMOMETER, TDR, THERMOCOUPLES, DEWPOINT HYDROMETERS, NET RADIOMETERS, IRGA, SOIL MOISTURE PROBE, BAROMETERS | 1996-02-02 to 1996-12-31 |
N: 53.63 S: 53.63 E: -106.2 W: -106.2 |
ASCII | |
| WRF-STILT Particle Trajectories for Boston, MA, USA, 2013-2014 | 1 | MODELS | Computer | 2013-07-01 to 2014-12-31 |
N: 49.19 S: 34.51 E: -65.93 W: -81.78 |
netCDF-4 | |
| Aeolus CalVal DAWN Wind Profiles | 1 | NASA DC-8 | DAWN | 2019-04-17 to 2019-04-30 | NetCDF-4 | ||
| First ISCCP Regional Experiment (FIRE) Atlantic Stratocumulus Transition Experiment (ASxTEX) ECMWF Basic Fields Data | 1 | MODELS | NOT APPLICABLE | 1992-06-01 to 1992-06-28 | ASCII | ||
| TOLNet NOAA Chemical Sciences Laboratory Data | 1 | GROUND STATIONS | TOPAZ | 2015-03-04 to Present | HDF4, ASCII | ||
| Site Averaged AMS Data: 1987 (Betts) | 1 | METEOROLOGICAL STATIONS | THERMOMETERS, BAROMETERS, NET RADIOMETERS, RAIN GAUGES, PYRANOMETERS, ANEMOMETERS | 1987-05-01 to 1987-12-31 |
N: 39.1161 S: 38.9753 E: -96.447 W: -96.611 |
CSV | |
| First ISCCP Regional Experiment (FIRE) Marine Stratocumulus National Center forAtmospheric Research (NCAR) Electra Aircraft Data | 1 | NCAR ELECTRA | PARTICLE DETECTORS, ALTIMETERS, AEROSOL MONITOR, TEMPERATURE SENSORS, WIND MONITOR, FSSP, GUST PROBES, Hotwire LWC, HYGROMETERS, LIDAR, PMS, PRESSURE TRANSDUCERS, PRT, PYRANOMETERS, Pyrgeometer, VIDEO CAMERA | 1987-06-29 to 1987-07-18 | ASCII |
SHOWING 10 OF 740
Featured Atmospheric Winds Observation Method: MODIS
The Moderate Resolution Imaging Spectroradiometer (MODIS) flies aboard the Terra and Aqua satellites and surveys Earth every one to two days. The multi-spectral instrument can be used in a variety of ways including detecting winds in different levels of the atmosphere.
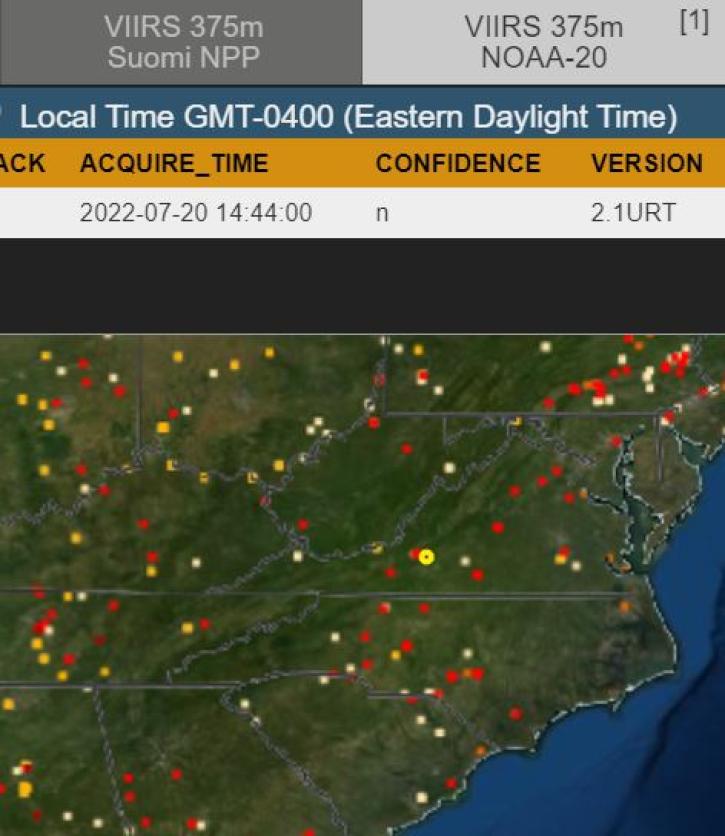
Scientists develop routine service for wildfire detection in the continental United States with a latency of less than 60 seconds.
6 MIN READ
Join us to learn how to discover, subset, access and visualize both MODIS and VIIRS data products using a suite of user-friendly tools developed by NASA's ORNL DAAC.
MODIS Terra Collection 6 Aerosol, Cloud, and other Atmospheric Level-2 and Level-3 Data
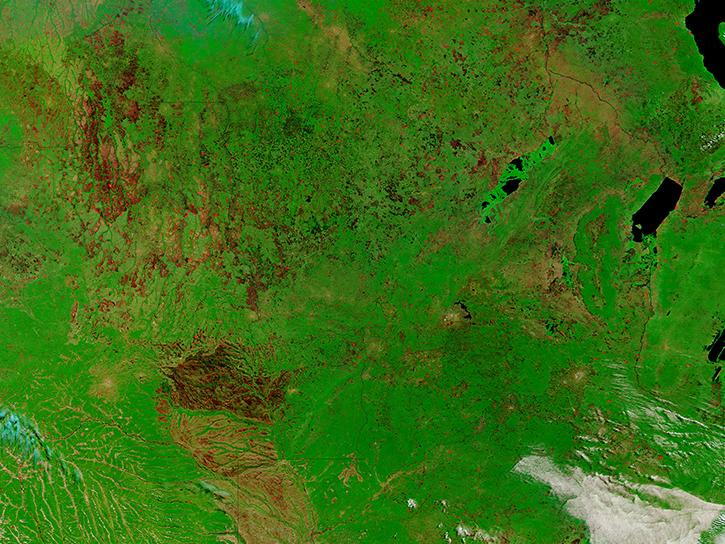
Learn how to access and use Moderate Resolution Imaging Spectroradiometer (MODIS) Version 6 land data.
Atmospheric Winds Data Tools
| Tool Sort descending | Description | Services | |
|---|---|---|---|
| Worldview | Worldview offers the capability to interactively browse over 1,200 global, full-resolution satellite imagery layers and download the underlying data. | Analysis, Search and Discovery, Visualization, Access, Comparison, Monitoring Natural Events |
SHOWING 1 OF 1
Frequently Asked Questions
Earthdata Forum
Our online forum provides a space for users to browse thousands of FAQs about research needs, data, and data applications. You can also submit new questions for our experts to answer.
Submit Questions to Earthdata Forumand View Expert Responses