Access a range of datasets and data tools to further your trace gases/trace species research.
In 1974, scientists discovered that chlorofluorocarbon (CFC) gases used for refrigeration, aerosol cans, and other purposes were destroying Earth’s protective ozone layer. As a result, in 1975 Congress directed NASA to “develop and carry out a comprehensive program of research, technology, and monitoring of the phenomena of the upper atmosphere so as to provide for an understanding of and to maintain the chemical and physical integrity of the Earth's upper atmosphere." NASA thus began monitoring and researching CFCs, ozone, carbon dioxide, and other trace gases, which are gases that account for less than 1% of the atmosphere by volume. Today, these trace gases are known to play important roles in Earth’s atmospheric chemistry, air quality, and climate.
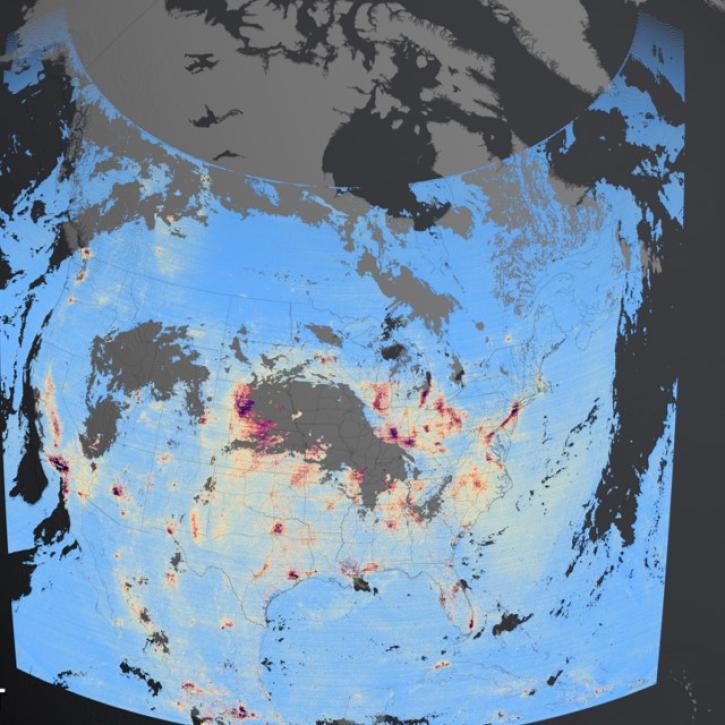
NASA has powerful and precise devices to detect and measure trace gases such as the Ozone Monitoring Instrument (OMI) and the Tropospheric Emissions: Monitoring of Pollution (TEMPO) instrument. Prime uses for their data include environmental protection, air pollution monitoring, and climate change modeling. Datasets from these instruments are available to anyone and can be easily accessed through Earthdata Search.
Learn How to Use Trace Gases/Trace Species Data


Join Our Community of NASA Data Users
While NASA data are openly available without restriction, an Earthdata Login is required to download data and to use some tools with full functionality.
Learn About the Benefits of Earthdata LoginFrequently Asked Questions
Earthdata Forum
Our online forum provides a space for users to browse thousands of FAQs about research needs, data, and data applications. You can also submit new questions for our experts to answer.
Submit Questions to Earthdata Forumand View Expert Responses