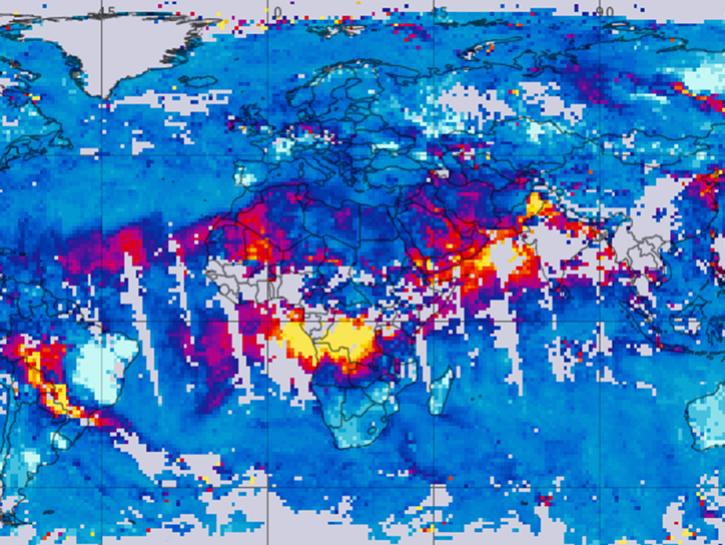
One of the most consequential forces shaping our planet is ourselves — the human species. When humans build cities, plant or cut down forests, grow crops, burn fuel, and alter bodies of water, it can have profound impacts on Earth's biosphere, both positive and negative. Understanding the ways in which humans interact with the environment and how the resulting changes affect Earth’s systems is important to ensuring that humans and other species can thrive. 

NASA’s Earth-observing satellites reveal the impacts humans have on ecosystems by collecting data on factors such as nighttime lights, forest cover, and air quality. Many of these datasets cover the entire globe. All of NASA’s Earthdata holdings are freely available for anyone to access. 

Our datasets useful to the study of human-influenced ecosystems include crop extent maps, urban air quality measurements, and land cover surveys. These measurements and higher-order data products enable important studies into how humans shape Earth and how we can better care for ourselves and our home.

Get Human-Influenced Ecosystems Data

Access a range of datasets and data tools to further your research.

Learn How to Use Anthropogenic/Human Influenced Ecosystems Data
Access a range of webinars, tutorials, data recipes, and data stories to enhance your knowledge of Earth Observation data.
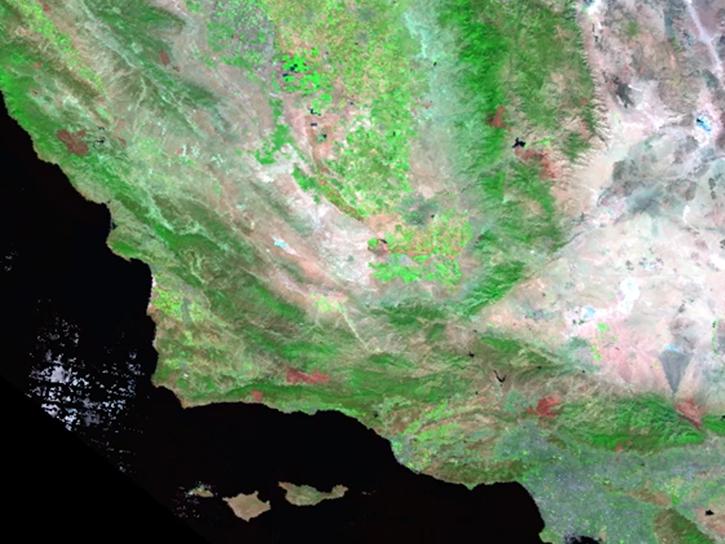
image of MODIS surface reflectance data
ORNL DAAC's MODIS and VIIRS Data Tools and Services at your Fingertips
Learn how to discover, subset, access and visualize both MODIS and VIIRS data products using a suite of user-friendly tools developed by NASA's ORNL DAAC.
image of Appeears geospatial data
Efficient Geospatial Data Access with NASA's AppEEARS
Learn more about NASA's Application for Extracting and Exploring Analysis Ready Samples (AppEEARS). This webinar showcases the system's capabilities and highlights learning resources to help simplify data access workflows using AppEEARS.
image of Giovanni data
Create Difference Maps for NASA Data with Giovanni, Panoply, and Excel
Two fundamental ways to use Earth remote sensing data are to examine anomalies and to monitor change. During this webinar we will show you how to generate difference maps with NASA Giovanni, Panoply and Excel.
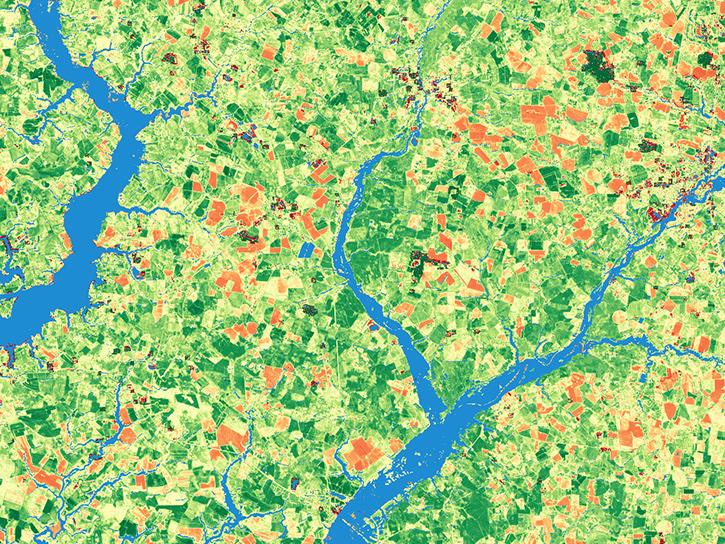
image of HLS data
Advancing Science Capabilities with Data Harmonization - NASA's Harmonized Landsat Sentinel-2 (HLS) Products
Join us for an introduction to HLS data, services, and tools.
Discover and Visualize Human Influenced Ecosystem Data
NASA data help us understand Earth's changing systems in more detail than ever before, and visualizations bring these data to life, making Earth science concepts accessible, beautiful, and impactful.
Data visualization is a powerful tool for analysis, trend and pattern recognition, and communication. Our resources help you find world-class data visualizations to complement and enhance your research. We also have tools and tutorials to help you translate human-influenced ecosystem data into compelling visuals.
Image
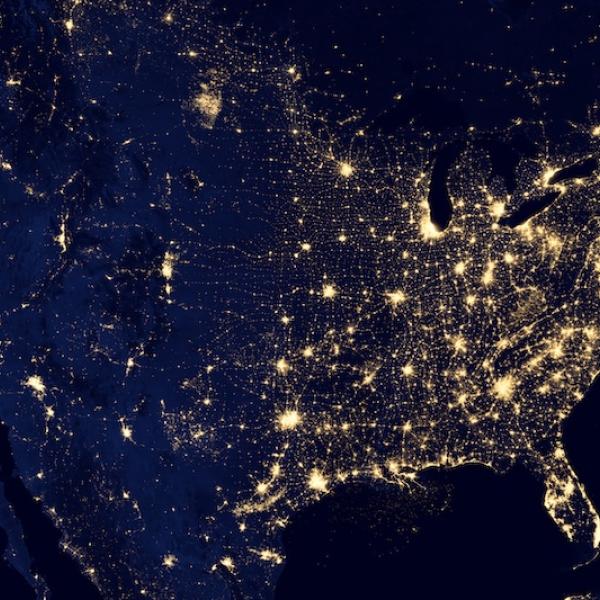
Composite image of the city lights of the United States at night.
This image of the United States of America at night is a composite assembled from data acquired by the day-night band of the Visible Infrared Imaging Radiometer Suite (VIIRS) instrument aboard the Suomi NPP satellite in April and October 2012.

Join Our Community of NASA Data Users

While NASA data are openly available without restriction, an Earthdata Login is required to download data and to use some tools with full functionality.

Learn About the Benefits of Earthdata Login

Frequently Asked Questions

Earthdata Forum

Our online forum provides a space for users to browse thousands of FAQs about research needs, data, and data applications. You can also submit new questions for our experts to answer.

Submit Questions to Earthdata Forumand View Expert Responses
Earthdata
Forum