On May 6 from 8:00 to 9:00 a.m. (US Eastern Time), the Data Catalog and Earthdata Search search may be temporarily unavailable due to maintenance of the NASA Common Metadata Repository (CMR).
Terrestrial Ecosystems Data Access and Tools
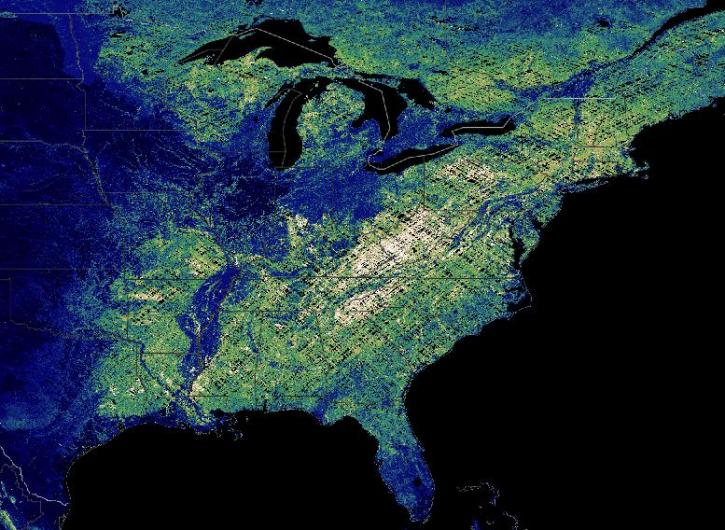
NASA has terrestrial ecosystem datasets that help researchers characterize natural areas around the world. Access a range of data and data tools such as AppEEARS, Worldview, and Giovanni to make the most of terrestrial ecosystem data.
Terrestrial Ecosystems Datasets
| Dataset Sort descending | Version | Platform | Instrument | Temporal Extent | Spatial Extent | Spatial Resolution | Data Format |
|---|---|---|---|---|---|---|---|
| A Concise Experiment Plan for the Arctic-Boreal Vulnerability Experiment | 1.1 | FIELD INVESTIGATION | Computer | 2014-01-01 to 2021-12-31 |
N: 81.6086 S: 39.415 E: -66.9178 W: -176.125 |
||
| ABoVE: Alder Shrub Cover and Soil Properties, Alaska, 2019, V2 | 2 | LANDSAT-8, LABORATORY, FIELD INVESTIGATION | OLI, CHN ANALYZERS, IRMS, VISUAL CENSUS TRANSECTS | 2018-08-14 to 2019-08-28 |
N: 68.0185 S: 66.3401 E: -149.708 W: -150.714 |
multiple | |
| ABoVE: Annual Aboveground Biomass for Boreal Forests of ABoVE Core Domain, 1984-2014 | 1 | LANDSAT-5, LANDSAT-7, Models, ICESat | TM, ETM+, Computer, GLAS | 1984-01-01 to 2014-12-31 |
N: 69.7323 S: 51.7769 E: -101.736 W: -165.41 |
GeoTIFF | |
| ABoVE: Burned Area, Depth, and Combustion for Alaska and Canada, 2001-2019 | 1 | Terra, LANDSAT, Aqua | MODIS, OLI, TIRS | 2001-01-01 to 2019-12-31 |
N: 72.9491 S: 42.885 E: -48.7792 W: -167.959 |
COG | |
| ABoVE: Characterization of Burned and Unburned Boreal Forest Stands, SK, Canada, 2016 | 1 | FIELD SURVEYS, Models | STEEL MEASURING TAPE, SOIL SAMPLER, CLINOMETERS, GPS, Computer | 2016-05-30 to 2016-06-16 |
N: 57.3646 S: 54.091 E: -104.693 W: -109.173 |
CSV | |
| ABoVE: Characterization of Carbon Dynamics in Burned Forest Plots, NWT, Canada, 2014 | 1 | FIELD SURVEYS, Models, LABORATORY | CLINOMETERS, Computer, MASS SPECTROMETERS | 2015-06-14 to 2015-06-14 |
N: 71.6947 S: 56.2542 E: -102 W: -136.119 |
CSV | |
| ABoVE: Distribution Maps of Wildland Fire Fuel Components across Alaskan Tundra, 2015 | 1 | LANDSAT-8 | OLI | 2013-01-01 to 2017-12-31 |
N: 72.5229 S: 57.3911 E: -132.487 W: -170.006 |
GeoTIFF | |
| ABoVE: Lake and Pond Extents in Alaskan Boreal and Tundra Subregions, 2019-2021 | 1 | PlanetScope | PlanetScope | 2019-05-19 to 2021-09-28 |
N: 67.2081 S: 60.7642 E: -143.836 W: -164.402 |
Shapefile | |
| ABoVE: Landsat Tundra Greenness and Summer Air Temperatures, Arctic Tundra, 1985-2016 | 1 | LANDSAT-5, LANDSAT-7, LANDSAT-8 | TM, ETM+, OLI | 1985-07-01 to 2016-08-31 |
N: 90 S: 31.49 E: 180 W: -180 |
multiple | |
| ABoVE: Landsat Vegetation Greenness Trends, Boreal Forest Biome, 1985-2019 | 1 | LANDSAT-5, LANDSAT-7, LANDSAT-8 | TM, ETM+, OLI, TIRS | 1985-01-01 to 2019-12-31 |
N: 72 S: 45 E: 180 W: -180 |
multiple | |
| ABoVE: Landsat-derived Annual Disturbance Agents Across ABoVE Core Domain, 1987-2012 | 1 | LANDSAT, LANDSAT-5 | ETM+, TM | 1985-01-01 to 2012-12-31 |
N: 75.6853 S: 50.259 E: -98.974 W: -169.96 |
multiple | |
| ABoVE: Landsat-derived Annual Dominant Land Cover Across ABoVE Core Domain, 1984-2014 | 1 | Models, LANDSAT-5, LANDSAT-7 | Computer, TM, ETM+ | 1984-01-01 to 2014-12-31 |
N: 76.2257 S: 50.259 E: -98.974 W: -170.006 |
multiple | |
| ABoVE: Landsat-derived Annual Dominant Land Cover in Boreal North America, 1986-2020 | 1 | COMPUTERS, LANDSAT-5, LANDSAT-7, LANDSAT-8 | Computer, TM, ETM+, OLI | 1986-01-01 to 2020-12-31 |
N: 71.0677 S: 41.2276 E: -50.1766 W: -166.685 |
COG | |
| ABoVE: LVIS L3 Gridded Vegetation Structure across North America, 2017 and 2019 | 1 | G-V | LVIS | 2017-06-29 to 2019-08-08 |
N: 78.1366 S: 7.126 E: -28.8244 W: -167.324 |
multiple | |
| ABoVE: Modeled Top Cover by Plant Functional Type over Alaska and Yukon, 1985-2020 | 1.1 | COMPUTERS | Computer | 1985-01-01 to 2020-12-31 |
N: 75.91 S: 51 E: -122.5 W: -176.1 |
multiple | |
| ABoVE: MODIS-Derived Daily Mean Blue Sky Albedo for Northern North America, 2000-2017 | 1.1 | SATELLITES | MODIS | 2000-02-24 to 2017-04-22 |
N: 79.0819 S: 41.6809 E: -52.6184 W: -173.089 |
multiple | |
| ABoVE: Needle-Level Chlorophyll Fluorescence, Alaska and Idaho, USA, 2017 and 2019 | 1 | FIELD SURVEYS, Models | FLUOROMETERS, PYRANOMETERS, Computer | 2017-07-07 to 2019-07-06 |
N: 67.9947 S: 44.9061 E: -116.067 W: -149.754 |
CSV | |
| ABoVE: Post-Fire and Unburned Field Site Data, Anaktuvuk River Fire Area, 2008-2017 | 1 | FIELD SURVEYS | SOIL DEPTH PROBE, VISUAL OBSERVATIONS | 2008-07-03 to 2017-07-23 |
N: 69.359 S: 69.0189 E: -150.034 W: -151.176 |
CSV | |
| ABoVE: Soil Active Layer Thaw Depths at CRREL sites near Fairbanks, Alaska, 2014-2018 | 1 | FIELD SURVEYS, FIELD INVESTIGATION | SOIL DEPTH PROBE, VISUAL OBSERVATIONS | 2014-10-15 to 2018-10-15 |
N: 64.9511 S: 64.8677 E: -147.612 W: -147.74 |
CSV | |
| ABoVE: Spatial Estimates of Carbon Combustion from Wildfires across SK, Canada, 2015 | 1 | Models | Computer | 2015-04-06 to 2015-08-11 |
N: 61.2389 S: 51.1943 E: -100.168 W: -116.055 |
GeoTIFF | |
| ABoVE: Study Domain and Standard Reference Grids | 1 | FIELD SURVEYS | Computer | 2014-01-01 to 2021-12-31 |
N: 90 S: -90 E: 180 W: -180 |
||
| ABoVE: Study Domain and Standard Reference Grids, Version 2 | 2.1 | FIELD SURVEYS | Computer | 2014-01-01 to 2023-04-20 |
N: 90 S: -90 E: 180 W: -180 |
multiple | |
| ABoVE: Synthesis of Burned and Unburned Forest Site Data, AK and Canada, 1983-2016 | 1 | Models, FIELD INVESTIGATION | Computer, PROBES, SOIL SAMPLER | 1983-01-01 to 2016-08-08 |
N: 67.2297 S: 53.1911 E: -88.612 W: -150.902 |
CSV | |
| ABoVE: Synthesis of Post-Fire Regeneration Across Boreal North America | 1.1 | FIELD SURVEYS | VISUAL OBSERVATIONS, Computer | 1989-01-01 to 2018-12-31 |
N: 66.9617 S: 49.1156 E: -71.0133 W: -152.2 |
CSV | |
| ABoVE: Terrestrial Lidar Scanning Forest-Tundra Ecotone, Brooks Range, Alaska, 2016 | 1 | FIELD SURVEYS | LIDAR | 2016-06-14 to 2016-06-25 |
N: 68.0204 S: 67.9704 E: -149.715 W: -149.765 |
multiple |
Featured Terrestrial Ecosystem Observation Method: GEDI Lidar
The Global Ecosystem Dynamics Investigation (GEDI) instrument is a full-waveform lidar aboard the International Space Station that maps the 3D structure of Earth’s surface. GEDI's three lasers precisely measure forest canopy height, canopy vertical structure, and surface elevation. The instrument's 3D data provide scientists with measurements to calculate the amount of biomass and carbon in forests and how much they lose when disturbed or destroyed.
Data from NASA’s Global Ecosystem Dynamics Investigation (GEDI) mission are adding to our understanding of carbon cycling and the structure and development of global biomes.
7 MIN READ
Join us for an introduction to GEDI Level 3 and Level 4 data products and to learn how to discover, access, visualize, and analyze the data.
Join us for an introduction to NASA’s Global Ecosystems Dynamics Investigation (GEDI) datasets and to learn how to use LP DAAC's web service, data prep script, and Jupyter Notebook Python tutorial series.
The latest dataset from the GEDI mission provides gridded estimates of aboveground biomass density at greater accuracy and resolution than previously available.
8 MIN READ
Frequently Asked Questions
Earthdata Forum
Our online forum provides a space for users to browse thousands of FAQs about research needs, data, and data applications. You can also submit new questions for our experts to answer.
Submit Questions to Earthdata Forumand View Expert Responses