Carbon flux is the direction and rate of transfer — or flow — of carbon between Earth’s carbon pools, such as the oceans, atmosphere, land, and living things. Carbon fluxes can be natural exchanges, such as land-atmosphere and ocean-atmosphere fluxes. The can also be human-triggered exchanges, such as urban carbon fluxes occurring within the built environment involving fossil fuel use and other processes. Understanding and tracking carbon flux is part of increasing our knowledge of Earth's carbon cycle and how it affects ecosystem function, plant growth, and climate.

NASA offers carbon flux data derived from multiple sources including computer models and the versatile Moderate Resolution Imaging Spectroradiometer (MODIS) and Global Ecosystem Dynamics Investigation (GEDI) lidar instruments.


Get Carbon Flux Data

Access a range of datasets and data tools to further your carbon flux research.

Learn How to Use Carbon Flux Data

Access a range of webinars, tutorials, data recipes, and data stories to enhance your knowledge of Earth Observation data.
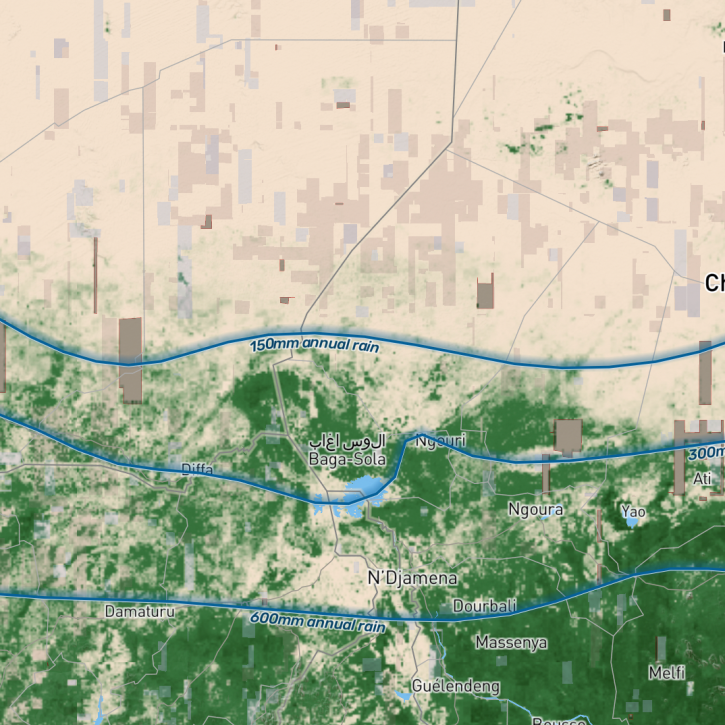
Brown base image with green areas indicating trees becoming more dense toward the bottom of the image. Blue lines show annual rainfall values.
NASA Counts 9.9 billion Trees Across Sub-Saharan Africa Using Commercial Satellite Data
The study, which utilized data made available by NASA’s Commercial SmallSat Data Acquisition (CSDA) program, was led by NASA’s Compton Tucker and provides new insight into how carbon stocks can be mapped at the level of individual trees.
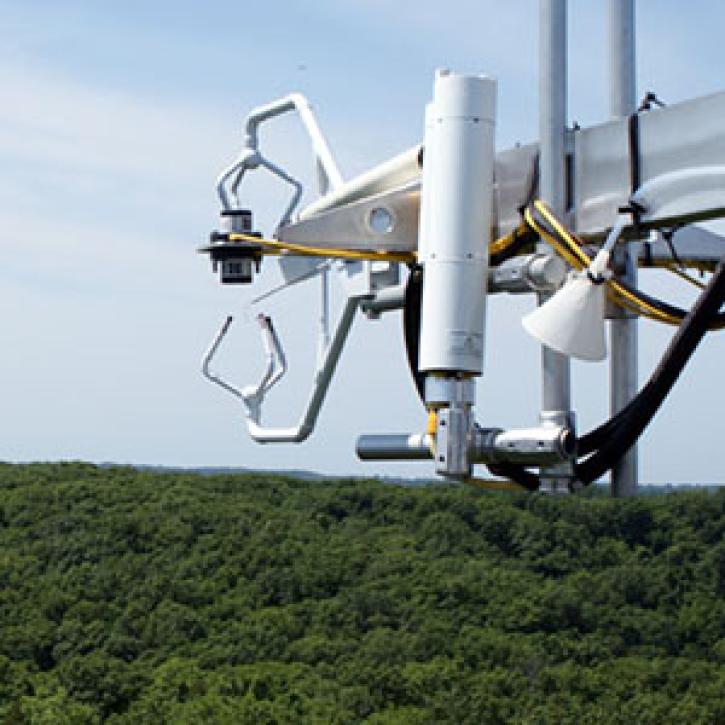
Sensors sniff out the comings and goings of carbon dioxide at the Missouri Ozarks AmeriFlux site. (
The Secrets of Leaves
A silent exchange between land and air reveals what we don't know.
The image above shows the northern lights (Aurora Borealis) as seen during long winter nights of the high latitude boreal forests.
Silvus Borealis
The relation between atmospheric carbon dioxide concentration and beavers may not be readily apparent to the average person.
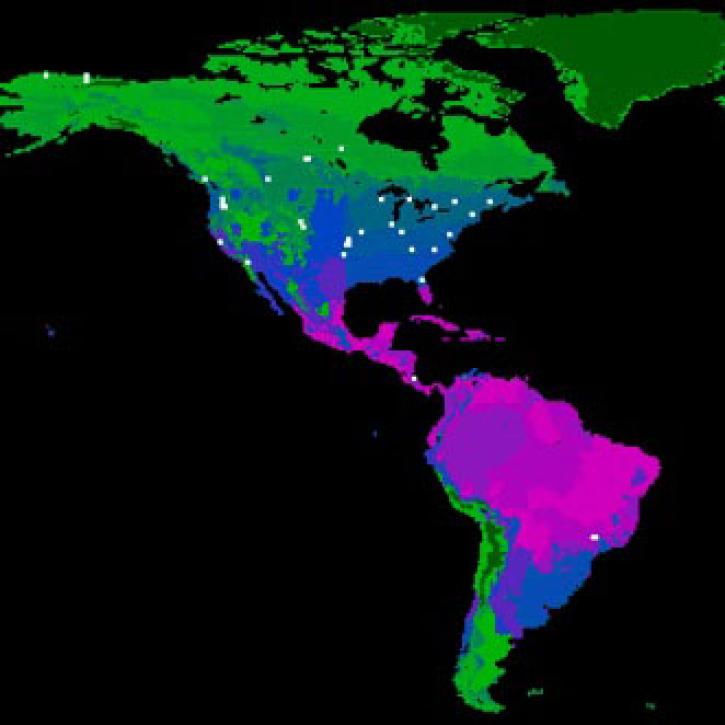
White dots indicate participating sites in the AmeriFlux network, part of the global FLUXNET program. (Image courtesy of AmeriFlux.
A View From Above
FLUXNET is a global network of research sites to measure regional carbon exchange.

Discover and Visualize Carbon Flux Data
NASA data help us understand Earth's changing systems in more detail than ever before, and visualizations bring these data to life, making Earth science concepts accessible, beautiful, and impactful.
Data visualization is a powerful tool for analysis, trend and pattern recognition, and communication. Our resources help you find world-class data visualizations to complement and enhance your research. We also have tools and tutorials to help you translate carbon flux data into compelling visuals.
Image
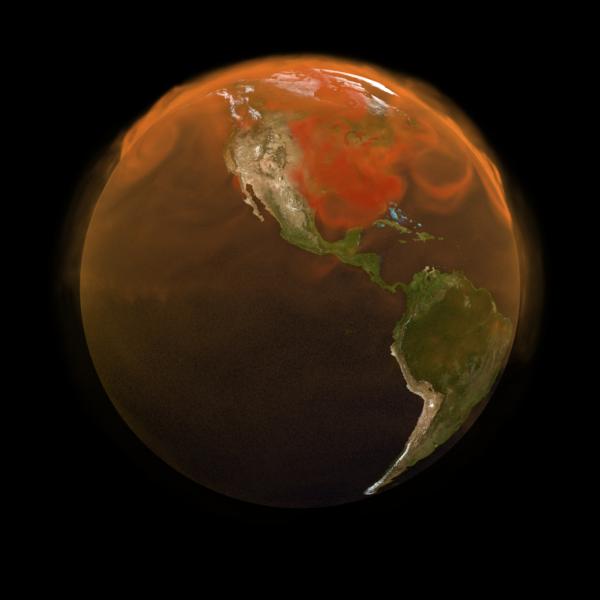
This image shows Earth shrouded in a layer of transparent orange-colored gas against a black background.. Occasional thicker plumes of gas a present around the globe.
A visualization of the total carbon dioxide on a global scale added on Earth's atmosphere over the course of the year 2021. The image was created by combining data from NASA’s Orbiting Carbon Observatory-2 (OCO-2) and the Goddard Earth Observing System (GOES) modeling and data assimilation technology. Credit: NASA's Scientific Visualization Studio

Join Our Community of NASA Data Users

While NASA data are openly available without restriction, an Earthdata Login is required to download data and to use some tools with full functionality.

Learn About the Benefits of Earthdata Login

Frequently Asked Questions

Earthdata Forum

Our online forum provides a space for users to browse thousands of FAQs about research needs, data, and data applications. You can also submit new questions for our experts to answer.

Submit Questions to Earthdata Forumand View Expert Responses
Earthdata
Forum