The 700,000 square kilometers of glaciers and nearly 16 million square kilometers of ice sheets on Earth make up about 10 percent of the planet's total land area. Glaciers are found on every continent except Australia, while the only remaining ice sheets are located in Greenland and Antarctica.

Glaciers typically develop when old accumulations of snow transform to ice. The ice builds up layer after layer, year after year, and slowly flows downhill over land. As glaciers age, the size of their crystals increase, some growing to be centimeters across. 

Scientists and decision-makers study glaciers and ice sheets for multiple reasons. They are important sources of water and aquatic nutrients. They influence and are greatly affected by weather. They shape land. They can pose hazards to communities. 

Land ice continually adds mass through precipitation and loses mass via meltwater runoff and the calving of icebergs into the ocean. If the losses are greater than gains, land ice loses mass, causing sea level to rise.  

How Are Glaciers/Ice Sheets Measured?

Researchers can use NASA's glacier and ice sheet data to accurately track the size, evolution, and impact of these great masses of ice. Scientists have generally used three approaches to measuring ice sheet mass balance: 

  • comparing outflow and melt to snowfall accumulation (the mass budget method)

  • observing changes in glacier elevation (volume change or geodetic method)

  • detecting changes in the Earth’s gravity field over the ice sheet (gravimetric method)

Since 2002, the Gravity Recovery and Climate Experiment series of satellites (GRACE and GRACE-FO) have made complete maps of Earth’s gravitational field every 30 days. Gravity is determined by mass. While most of the planet’s mass—its surface crust (tectonic plates), mantle, and core—does not move much in 30 days, its water and ice do, causing Earth’s gravity to shift slightly. By tracking these slight changes, GRACE and GRACE-FO can identify how much ice sheets, icefields, ice caps, and mountain glaciers are changing. 

Get Glaciers/Ice Sheets Data

Access a range of datasets and data tools to further your research.

Learn How to Use Glaciers/Ice Sheets Data

Access a range of webinars, tutorials, data recipes, and data stories to enhance your knowledge of Earth Observation data.
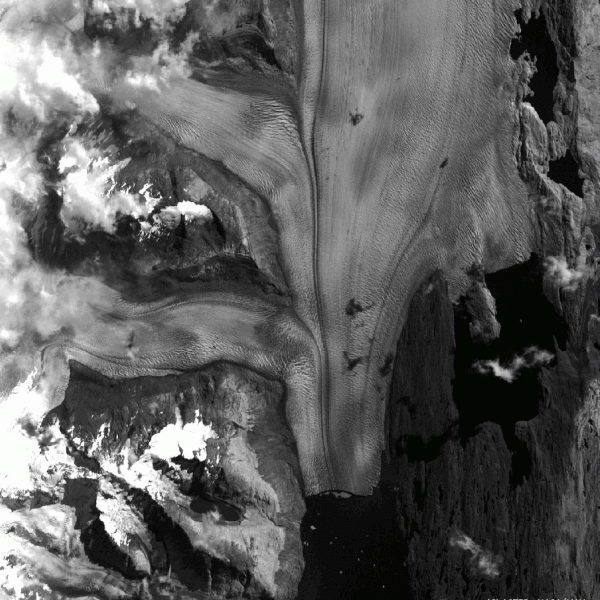
An ASTER image showing part of the San Quintín Glacier, the largest in southern Chile’s Northern Patagonia Icefield.
GLIMS Database Advances Glacier Monitoring from Space
The Global Land Ice Measurements from Space (GLIMS) Glacier Database provides timely data on more than 200,000 glaciers around the world.
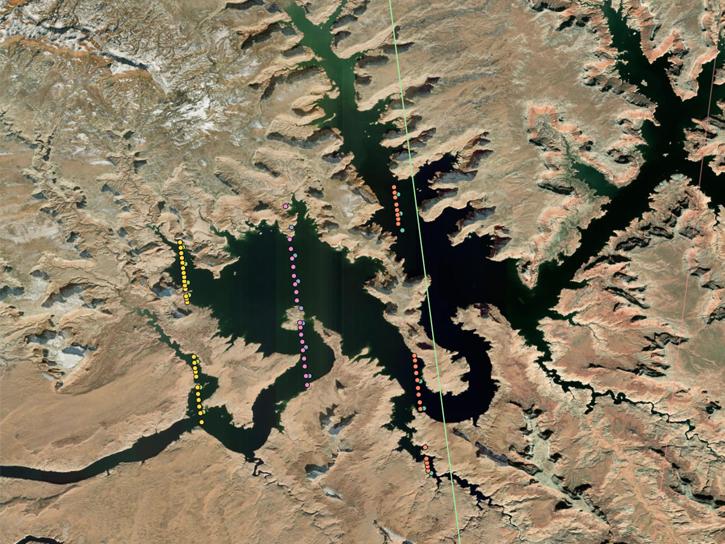
Location of NASA ICESat-2 (ATL13) data (Inland Water Product) from April 25, 2023 over Lake Powell, Utah, United States, viewed in OpenAltimetry.
Laser Altimetry Applications for a Changing World: Working with ICESat-2 Sea Ice Data
This is the final webinar in a four-part series to explore NASA's Ice, Cloud, and land Elevation-2 (ICESat-2) platform and the related data, tools, and applications.
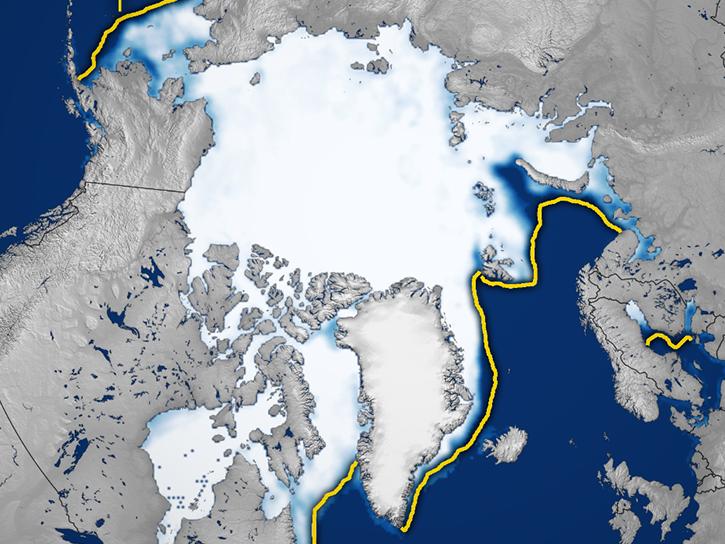
image of icebridge data
Explore, Discover, and Access Snow and Ice Data with NSIDC DAAC
Join us for a tour of enhanced data product landing pages, new user resources, data visualization tools, and a Jupyter Notebook tutorial to access cryospheric data at NASA's National Snow and Ice Data Center DAAC.
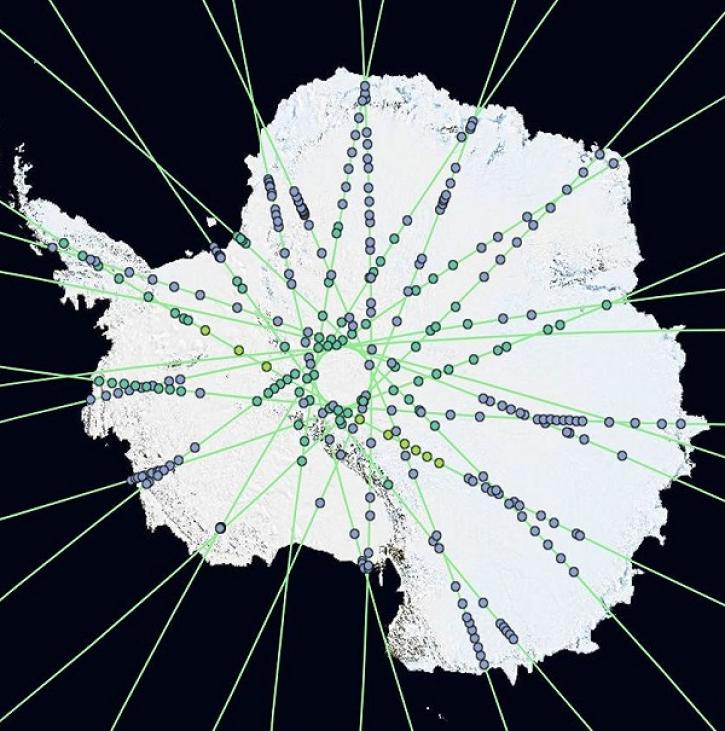
An image of Antarctica from OpenAltimetry showing the satellite tracks and data-acquisition points along the continent's surface.
Data Tool in Focus: OpenAltimetry
OpenAltimetry lets users explore changes on Earth’s surface around the globe and over time, and all they need is a web browser.
Discover and Visualize Glaciers and Ice Sheets Data
NASA data help us understand Earth's changing systems in more detail than ever before, and visualizations bring these data to life, making Earth science concepts accessible, beautiful, and impactful.
Data visualization is a powerful tool for analysis, trend and pattern recognition, and communication. Our resources help you find world-class data visualizations to complement and enhance your research. We also have tools and tutorials to help you translate glaciers and ice sheets data into compelling visuals.
Image
An animation of ASTER and Sentinel-2 imagery shows the retreat of the Upsala Glacier in Argentina between 2003 to 2024.
This ASTER and Sentinel-2 imagery shows the retreat of the Upsala Glacier in Argentina between 2003 to 2024. Image courtesy of Etienne Berthier.

Join Our Community of NASA Data Users

While NASA data are openly available without restriction, an Earthdata Login is required to download data and to use some tools with full functionality.

Learn About the Benefits of Earthdata Login

Frequently Asked Questions

Earthdata Forum

Our online forum provides a space for users to browse thousands of FAQs about research needs, data, and data applications. You can also submit new questions for our experts to answer.

Submit Questions to Earthdata Forumand View Expert Responses

Earthdata
Forum