We are in the process of migrating all NASA Earth science data sites into Earthdata from now until end of 2026. Not all NASA Earth science data and resources will appear here until then. Thank you for your patience as we make this transition.
Read about the Web Unification Project
Tropical Cyclones Data Access and Tools
From discovery to visualization, data tools such as Worldview, Application for Extracting and Exploring Analysis Ready Samples (AppEEARS), and the Moderate Resolution Imaging Spectroradiometer (MODIS)/Visible Infrared Imaging Radiometer Suite (VIIRS) Subsetting Tools Suite guide users in making the most of tropical cyclones data.
Tropical Cyclones Datasets
| Dataset Sort descending | Version | Platform | Instrument | Temporal Extent | Spatial Extent | Spatial Resolution | Data Format |
|---|---|---|---|---|---|---|---|
| Geocoded Disasters (GDIS) Dataset | 1.00 | MODELS | Computer | 1960-01-01 to 2018-12-31 |
N: 90 S: -58 E: 180 W: -180 |
CSV, Geodatabase, GeoPackage, RData, PDF, PDF, PNG | |
| Global Cyclone Hazard Frequency and Distribution | 1.0 | MODELS | Computer | 1980-01-01 to 2000-12-31 |
N: 85 S: -58 E: 180 W: -180 |
0.0417 Decimal Degrees x 0.0417 Decimal Degrees | ASCII, PNG, PDF, WMS |
| Global Cyclone Mortality Risks and Distribution | 1.0 | MODELS | Computer | 2000-01-01 to 2000-12-31 |
N: 85 S: -58 E: 180 W: -180 |
0.0417 Decimal Degrees x 0.0417 Decimal Degrees | ASCII, DBF, PDF, PNG, WMS |
| Global Cyclone Proportional Economic Loss Risk Deciles | 1.0 | MODELS | Computer | 2000-01-01 to 2000-12-31 |
N: 86 S: -58 E: 180 W: -180 |
0.0417 Decimal Degrees x 0.0417 Decimal Degrees | ASCII, PDF, PNG, WMS |
| Global Cyclone Total Economic Loss Risk Deciles | 1.0 | MODELS | Computer | 2000-01-01 to 2000-12-31 |
N: 86 S: -58 E: 180 W: -180 |
0.0417 Decimal Degrees x 0.0417 Decimal Degrees | ASCII, DBF, PDF, PNG, WMS |
| Global Multihazard Frequency and Distribution | 1.0 | MODELS | Computer | 2000-01-01 to 2000-12-31 |
N: 85 S: -58 E: 180 W: -180 |
0.0417 Decimal Degrees x 0.0417 Decimal Degrees | ASCII, DBF, PDF, PNG |
| Global Multihazard Mortality Risks and Distribution | 1.0 | MODELS | Computer | 2000-01-01 to 2000-12-31 |
N: 85 S: -58 E: 180 W: -180 |
0.0417 Decimal Degrees x 0.0417 Decimal Degrees | ASCII, DBF, PDF, PNG |
| Global Multihazard Proportional Economic Loss Risk Deciles | 1.0 | MODELS | Computer | 2000-01-01 to 2000-12-31 |
N: 85 S: -58 E: 180 W: -180 |
0.0417 Decimal Degrees x 0.0417 Decimal Degrees | ASCII, DBF, PDF, PNG |
| Global Multihazard Total Economic Loss Risk Deciles | 1.0 | MODELS | Computer | 2000-01-01 to 2000-12-31 |
N: 85 S: -58 E: 180 W: -180 |
0.0417 Decimal Degrees x 0.0417 Decimal Degrees | ASCII, DBF, PDF, PNG |
| GRIP Hurricane and Tropical Storm Forecasts V1 | 1 | MODELS | Computer | 2010-08-12 to 2010-11-14 |
N: 87.6 S: 0.8 E: 0 W: -178.5 |
ASCII | |
| HURRICANE AND SEVERE STORM SENTINEL (HS3) GLOBAL HAWK NAVIGATION V1 | 1 | GLOBAL HAWK | GPS, INS | 2012-09-06 to 2014-09-30 |
N: 51.5268 S: 7.55657 E: -19.4239 W: -174.843 |
ASCII, XML | |
| HURRICANE AND SEVERE STORM SENTINEL (HS3) WORLD WIDE LIGHTNING LOCATION NETWORK (WWLLN) STORMS V1 | 1 | WWLLN | GPS, RF ANTENNA, VLF RECEIVERS | 2012-08-28 to 2014-10-20 |
N: 68.994 S: 12.9 E: -15.001 W: -116.595 |
netCDF-4, ASCII | |
| U.S. Climate Risk Projections by County, 2040-2049 | 1.00 | MODELS | Computer | 2040-01-01 to 2049-12-31 |
N: 72 S: 17 E: -65 W: -180 |
Shapefile, PDF, PNG, Excel |
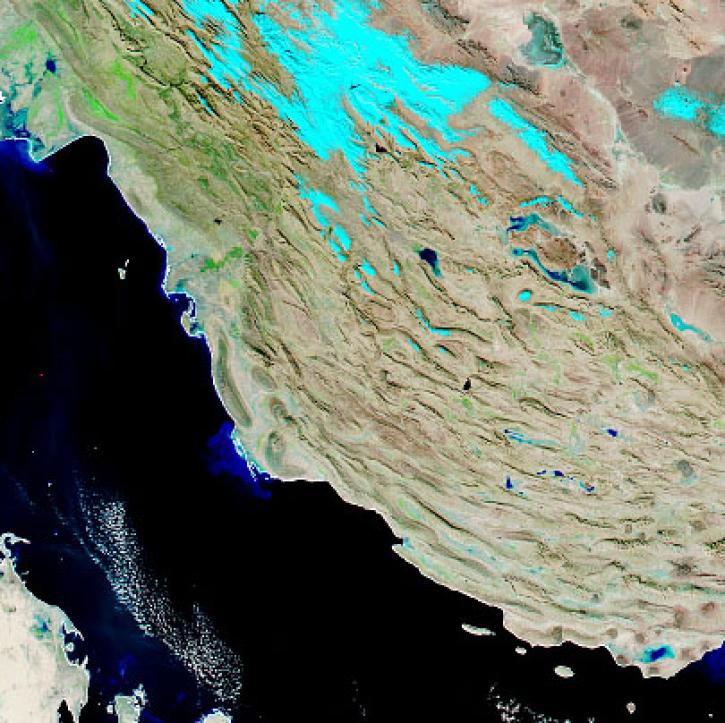
Featured Observation Method: VIIRS
The Visible Infrared Imaging Radiometer Suite (VIIRS) is an instrument aboard the joint NASA/NOAA Suomi National Polar-orbiting Partnership (Suomi NPP) and NOAA-20 platforms. VIIRS can take daily images cross multiple spectrum bands to collect high-resolution atmospheric imagery and other instrument products including visible and infrared images of hurricanes.
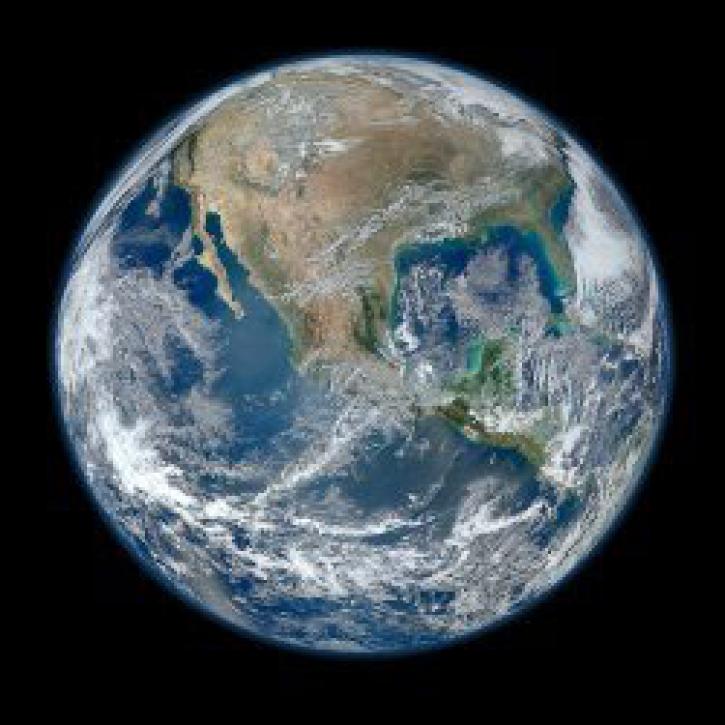
With the eventual retirement of the Terra and Aqua platforms, the Visible Infrared Imaging Radiometer Suite (VIIRS) instruments will take the lead in daily Earth observations.
19 MIN READ
VIIRS I-band (375 m) Active Fire and Corrected Reflectance products are the newest near real-time products available through LANCE.
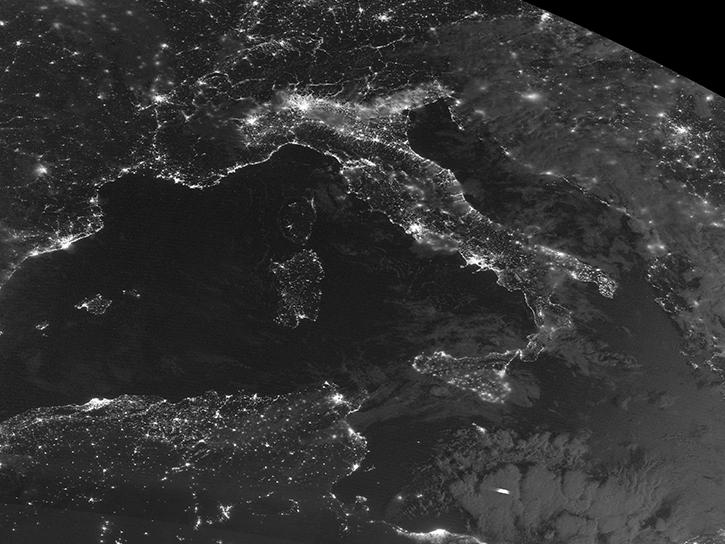
The new Level 1 products are created from data acquired by the Visible Infrared Imaging Radiometer Suite (VIIRS) aboard the NOAA-21/Joint Polar Satellite System-2 (JPSS-2) spacecraft.
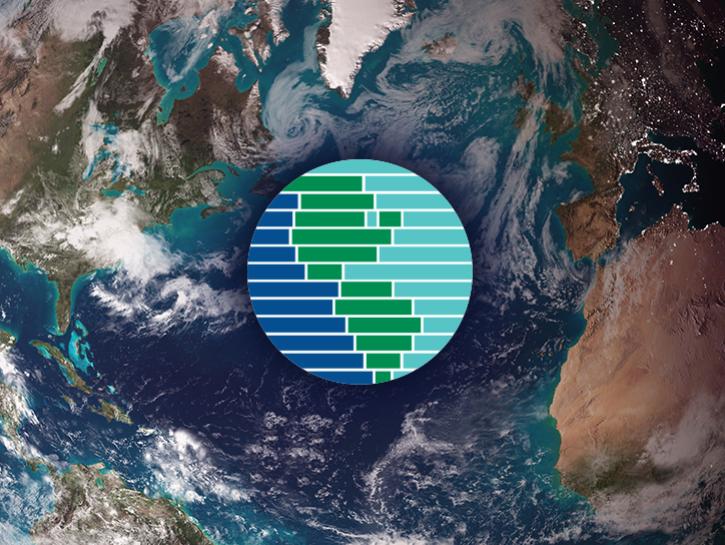
Join us to learn how to discover, subset, access and visualize both MODIS and VIIRS data products using a suite of user-friendly tools developed by NASA's ORNL DAAC.
Frequently Asked Questions
Earthdata Forum
Our online forum provides a space for users to browse thousands of FAQs about research needs, data, and data applications. You can also submit new questions for our experts to answer.
Submit Questions to Earthdata Forumand View Expert Responses