Complex environmental processes shape the coastlines of Earth’s land masses. Water and winds sculpt beaches, cliffs, and other landforms through erosion and sedimentation. Weather events, human activity, and changes in sea levels can also shape the coastline in significant ways. 

Coastal landforms support important ecosystems and often protect inland areas from flooding. These habitats may flourish or deteriorate based on coastal processes. When coastal ecosystems are disrupted, it can have drastic negative effects on plant and animal life, human settlements near the coastline, and the fishing and shipping industries. 

NASA’s Earth-observing satellites collect data about how coasts change over time, providing vital insight into the processes that shape these landforms. Researchers use these data products to study coastal environments, understand the interactions between the land and the ocean, and come up with ways to better prepare for natural disasters.

Get Coastal Processes Data

Access a range of datasets and data tools to further your research into coastal processes.

Learn How to Use Coastal Processes Data
Access a range of webinars, tutorials, data recipes, and data stories to enhance your knowledge of Earth Observation data.
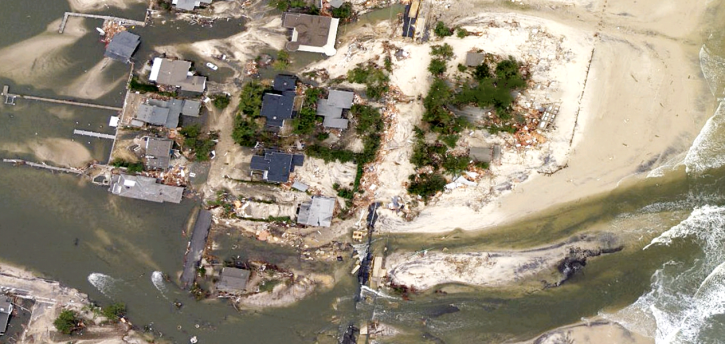
This is an aerial view of coastal flooding in Mantolokig, NJ. This rectangular image shows sandy land, trees, roads, houses, and other structures washed out by flooding water.
UNBOUND for Coastal Issues Data Workshop Report Released
This Understanding Needs to Broaden Outside Use of NASA Data (UNBOUND) workshop connected coastal zone groups with key NASA data.
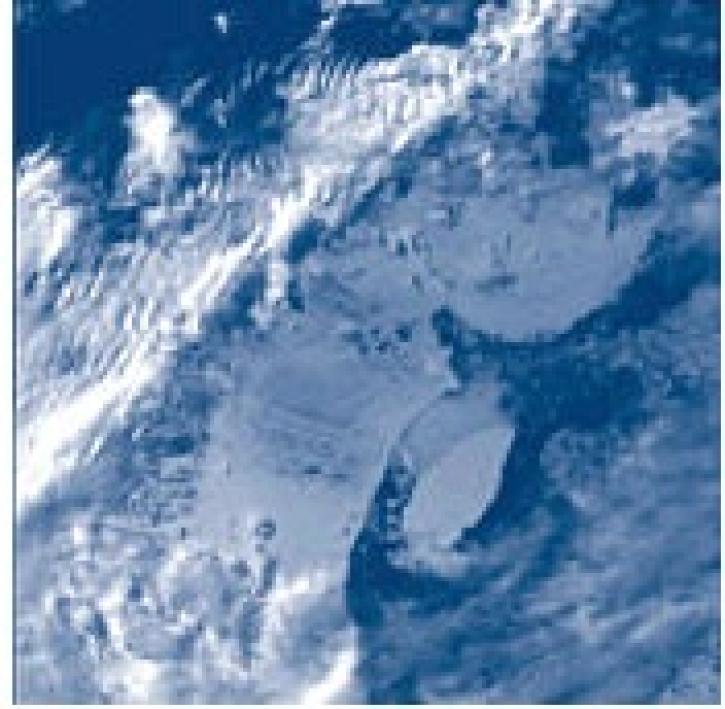
Larsen B Ice Shelf West Antarctic Peninsula
Disintegration of the Ninnis Glacier Tongue
An analysis of satellite imagery showed that a large glacier tongue on the coast of East Antarctica disintegrated, changing the shape of the coastline almost overnight.
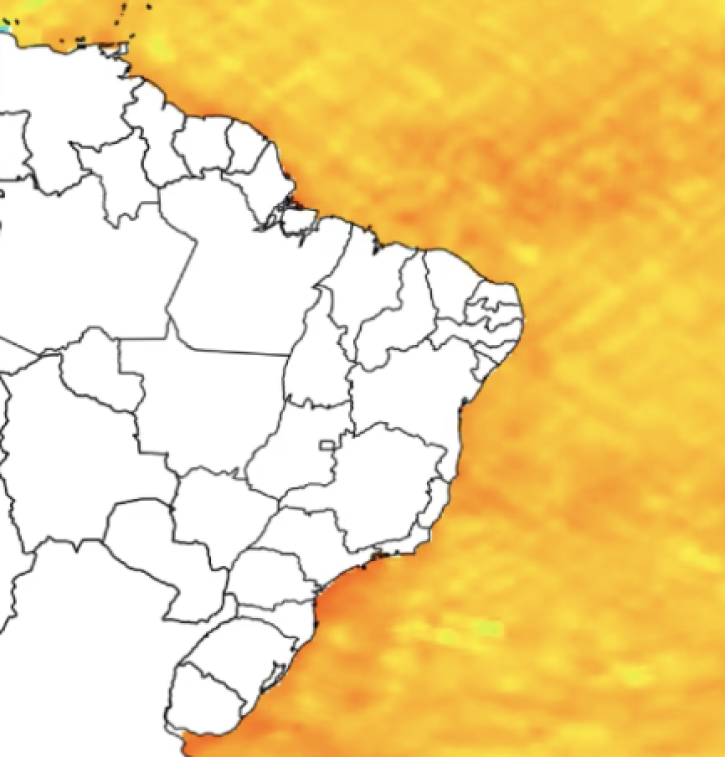
Image from the H2Plastic Dashboard showing microplastic concentrations along the coast of Brazil visualized by the H2Plastic team using CYGNSS data.
Planet vs. Plastics: Quantifying Microplastics Along the Brazilian Coast
Using NASA Earth observation data, researchers assessed miles of Brazilian coastline to identify high-risk points of fish contaminated with microplastics.
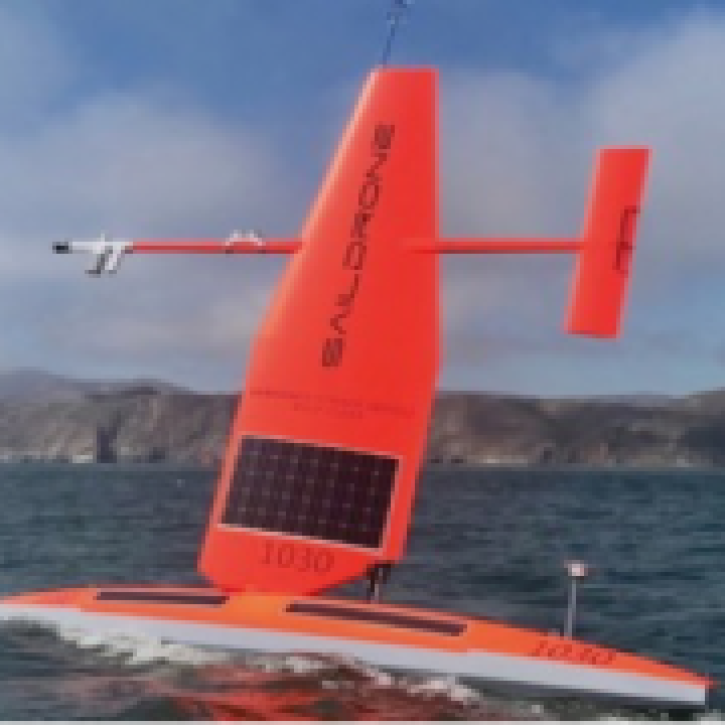
Photograph of a saildrone along the California coast
Saildrone Baja Field Campaign Data Available at PO.DAAC
Data collected by the autonomous Saildrone unmanned surface vehicle (USV) during its 60-day cruise along the California coast and Baja Peninsula are now available at PO.DAAC.
Discover and Visualize Coastal Processes Data
NASA data help us understand Earth's changing systems in more detail than ever before, and visualizations bring these data to life, making Earth science concepts accessible, beautiful, and impactful.
Data visualization is a powerful tool for analysis, trend and pattern recognition, and communication. Our resources help you find world-class data visualizations to complement and enhance your research. We also have tools and tutorials to help you translate coastal process data into compelling visuals.
Image
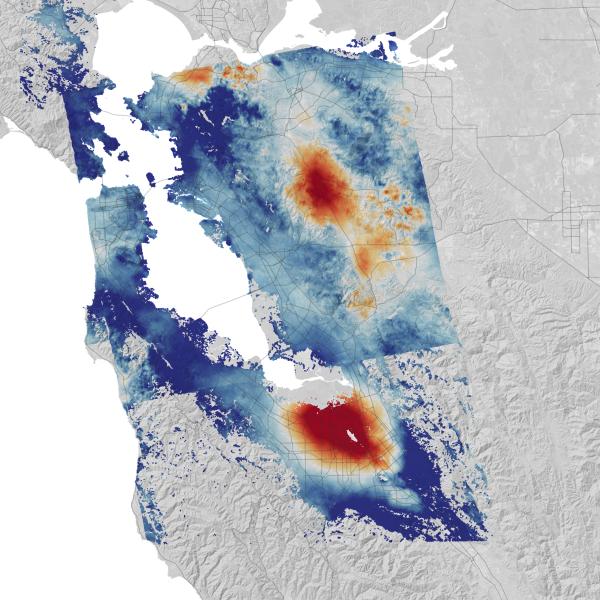
A map of California's San Francisco Bay Area with the amounts of vertical land motion colored in red for rising areas and blue for falling areas.
This map, created from satellite data collected between 2007 and 2018, highlights the variability in the rising and falling of coastal land in California's Bay Area. Areas shown in blue are subsiding, and areas shown in red are rising. Credit: NASA Earth Observatory.

Join Our Community of NASA Data Users

While NASA data are openly available without restriction, an Earthdata Login is required to download data and to use some tools with full functionality.

Learn About the Benefits of Earthdata Login

Frequently Asked Questions

Earthdata Forum

Our online forum provides a space for users to browse thousands of FAQs about research needs, data, and data applications. You can also submit new questions for our experts to answer.

Submit Questions to Earthdata Forumand View Expert Responses
Earthdata
Forum