We are in the process of migrating all NASA Earth science data sites into Earthdata from now until end of 2026. Not all NASA Earth science data and resources will appear here until then. Thank you for your patience as we make this transition.
Read about the Web Unification Project
Soil Moisture/Water Content Data Access and Tools
NASA has soil moisture and water content datasets that help researchers characterize the condition of soil around the world. Access a range of data and data tools such as the Soil Moisture Visualizer, Crop Condition and Soil Moisture Analytics (Crop-CASMA), and AppEEARS to make the most of soil moisture data.
Soil Moisture/Water Content Datasets
| Dataset Sort descending | Version | Platform | Instrument | Temporal Extent | Spatial Extent | Spatial Resolution | Data Format |
|---|---|---|---|---|---|---|---|
| ABCFlux v2: Arctic-Boreal CO2 and CH4 In-situ Flux and Environmental Data | 1 | FIELD SURVEYS | SOIL MOISTURE PROBE, SOIL TEMPERATURE PROBE, SURVEYING TOOLS, EDDY CORRELATION DEVICES | 1984-05-01 to 2024-12-31 |
N: 82.8226 S: 43.323 E: 161.843 W: -165.833 |
CSV | |
| ABoVE: Active Layer and Soil Moisture Properties from AirMOSS P-band SAR in Alaska | 1 | G-III, MODELS | RADAR, Computer | 2014-08-16 to 2017-10-10 |
N: 70.8774 S: 64.7127 E: -150.249 W: -167.944 |
netCDF-4 classic | |
| ABoVE: Active Layer Soil Characteristics at Selected Sites Across Alaska | 1 | FIELD SURVEYS | CORING DEVICES | 2016-08-09 to 2018-07-07 |
N: 68.5596 S: 63.8801 E: -146.558 W: -149.533 |
multiple | |
| ABoVE: Active Layer Soil Characterization of Permafrost Sites, Northern Alaska, 2018 | 1 | LABORATORY, FIELD SURVEYS | BALANCE, SOIL DEPTH PROBE | 2018-08-22 to 2018-08-26 |
N: 69.8124 S: 68.605 E: -148.564 W: -149.306 |
CSV | |
| ABoVE: Active Layer Thickness from Airborne L- and P- band SAR, Alaska, 2017, Ver. 3 | 3 | GULFSTREAM 1000 (695A) | UAVSAR | 2017-06-19 to 2017-09-16 |
N: 71.5212 S: 57.8294 E: -110.418 W: -166.733 |
multiple | |
| ABoVE: Alder Shrub Cover and Soil Properties, Alaska, 2019, V2 | 2 | LANDSAT-8, LABORATORY, FIELD INVESTIGATION | OLI, CHN ANALYZERS, IRMS, VISUAL CENSUS TRANSECTS | 2018-08-14 to 2019-08-28 |
N: 68.0185 S: 66.3401 E: -149.708 W: -150.714 |
multiple | |
| ABoVE: Burn Severity, Fire Progression, and Field Data, NWT, Canada, 2015-2016 | 1 | FIELD SURVEYS, Aqua, Terra | SOIL TEMPERATURE PROBE, SOIL MOISTURE PROBE, MODIS | 2015-05-20 to 2016-08-08 |
N: 68.327 S: 59.927 E: -106.759 W: -135.543 |
CSV | |
| ABoVE: Burn Severity, Fire Progression, Landcover and Field Data, NWT, Canada, 2014 | 1 | Terra, FIELD SURVEYS, Aqua | MODIS, SOIL MOISTURE PROBE, SOIL TEMPERATURE PROBE | 1997-07-07 to 2015-07-15 |
N: 64.2509 S: 60.3334 E: -110.677 W: -121.604 |
multiple | |
| ABoVE: Characterization of Burned and Unburned Boreal Forest Stands, SK, Canada, 2016 | 1 | FIELD SURVEYS, MODELS | STEEL MEASURING TAPE, SOIL SAMPLER, CLINOMETERS, GPS, Computer | 2016-05-30 to 2016-06-16 |
N: 57.3646 S: 54.091 E: -104.693 W: -109.173 |
CSV | |
| ABoVE: Characterization of Burned and Unburned Spruce Forest Sites, Tanana, AK, 2017 | 1 | FIELD SURVEYS, LANDSAT | PROBES, SOIL MOISTURE PROBE, TM | 2017-07-26 to 2017-07-28 |
N: 65.2315 S: 65.0968 E: -151.951 W: -152.416 |
CSV | |
| ABoVE: CO2 and CH4 Fluxes and Meteorology at Flux Tower Sites, Alaska, 2015-2017 | 1 | FIELD SURVEYS, GROUND STATIONS, METEOROLOGICAL STATIONS | PROBES, NET RADIOMETERS, LICOR QUANTUM SENSOR, THERMOCOUPLES, EDDY CORRELATION DEVICES, PYRANOMETERS | 2015-01-01 to 2017-03-09 |
N: 71.282 S: 68.4864 E: -155.75 W: -157.41 |
CSV | |
| ABoVE: Land Cover, Methane Flux, and Environmental Data, Big Trail Lake, Fairbanks AK | 1 | MODELS, FIELD INVESTIGATION | Computer, SOIL MOISTURE PROBE | 2017-05-28 to 2022-08-23 |
N: 64.9231 S: 64.9201 E: -147.816 W: -147.825 |
multiple | |
| ABoVE: Monthly Hydrological Fluxes for Canada and Alaska, 1979-2018 | 1 | MODELS | Computer | 1979-01-01 to 2018-04-01 |
N: 83.125 S: 41.7508 E: -53.4255 W: -172.25 |
multiple | |
| ABoVE: Post-Fire and Unburned Vegetation Community and Field Data, NWT, Canada, 2017 | 1 | FIELD INVESTIGATION | VISUAL OBSERVATIONS, SOIL MOISTURE PROBE | 2015-07-13 to 2017-08-10 |
N: 62.5827 S: 60.5236 E: -111.367 W: -117.379 |
multiple | |
| ABoVE: Post-Fire and Unburned Vegetation Community and Field Data, NWT, Canada, 2018 | 1 | FIELD SURVEYS | SOIL MOISTURE PROBE, STEEL MEASURING TAPE | 2018-08-12 to 2018-08-22 |
N: 62.5658 S: 60.4524 E: -113.42 W: -117.425 |
CSV | |
| ABoVE: Post-Fire and Unburned Vegetation Community and Field Data, NWT, Canada, 2019 | 1 | FIELD INVESTIGATION | SOIL MOISTURE PROBE, SOIL TEMPERATURE PROBE, SOIL DEPTH PROBE | 2018-08-16 to 2019-09-05 |
N: 62.5658 S: 60.9206 E: -113.016 W: -117.425 |
CSV | |
| ABoVE: Soil Moisture and Active Layer Thickness in Alaska and NWT, Canada, 2008-2020 | 1 | FIELD SURVEYS | PROBES, GPR, TDR | 2008-06-22 to 2020-08-15 |
N: 71.3236 S: 60.4524 E: -111.368 W: -165.973 |
CSV | |
| ABoVE: Soil Moisture and Active Layer Thickness in Alaska, USA and Canada, 2005-2022 | 1 | FIELD SURVEYS | SOIL DEPTH PROBE, SOIL MOISTURE PROBE | 2005-01-10 to 2022-09-28 |
N: 71.3236 S: 58.2077 E: -111.368 W: -165.974 |
CSV | |
| ABoVE: Soil Moisture and ALT Field Collection Protocols and Probe Calibration | 1 | FIELD SURVEYS | SOIL DEPTH PROBE, SOIL MOISTURE PROBE, SURVEYING TOOLS | 2015-01-01 to 2024-12-31 |
N: 81.6086 S: 39.415 E: -66.9178 W: -176.125 |
||
| ABoVE: Soil Temperature and VWC at Unburned and Burned Sites Across Alaska, 2016-2023 | 1 | FIELD SURVEYS | TEMPERATURE LOGGERS, TEMPERATURE SENSORS | 2016-08-11 to 2023-09-02 |
N: 68.9908 S: 61.2701 E: -146.558 W: -163.239 |
CSV | |
| ABoVE: Synthesis of Burned and Unburned Forest Site Data, AK and Canada, 1983-2016 | 1 | MODELS, FIELD INVESTIGATION | Computer, PROBES, SOIL SAMPLER | 1983-01-01 to 2016-08-08 |
N: 67.2297 S: 53.1911 E: -88.612 W: -150.902 |
CSV | |
| ABoVE: Wildfire Carbon Emissions and Burned Plot Characteristics, NWT, CA, 2014-2016 | 1 | MODELS, FIELD SURVEYS, LABORATORY | Computer, STEEL MEASURING TAPE, CARBON ANALYZERS | 2014-07-02 to 2016-08-01 |
N: 71.6982 S: 56.2534 E: -102 W: -136.127 |
multiple | |
| AirMOSS: In Situ Soil Moisture and Tree Measurements, Harvard Forest, 2012-2013 | 1 | FIELD SURVEYS | SOIL MOISTURE PROBE, SOIL TEMPERATURE PROBE, STEEL MEASURING TAPE | 2012-10-15 to 2013-08-22 |
N: 42.5492 S: 42.5361 E: -71.1755 W: -72.184 |
CSV | |
| AirMOSS: L2 Hourly In-Ground Soil Moisture at AirMOSS Sites, 2011-2015 | 1 | FIELD INVESTIGATION | SOIL MOISTURE PROBE | 2011-09-01 to 2015-12-31 |
N: 53.9169 S: 19.5086 E: -72.1712 W: -121.558 |
netCDF-4 classic | |
| AirMOSS: L2/3 Volumetric Soil Moisture Profiles Derived From Radar, 2012-2015 | 1.1 | C-23 Sherpa | RADAR | 2012-09-18 to 2015-09-29 |
N: 54.1254 S: 9.87958 E: -68.3196 W: -123.283 |
netCDF-4 classic |
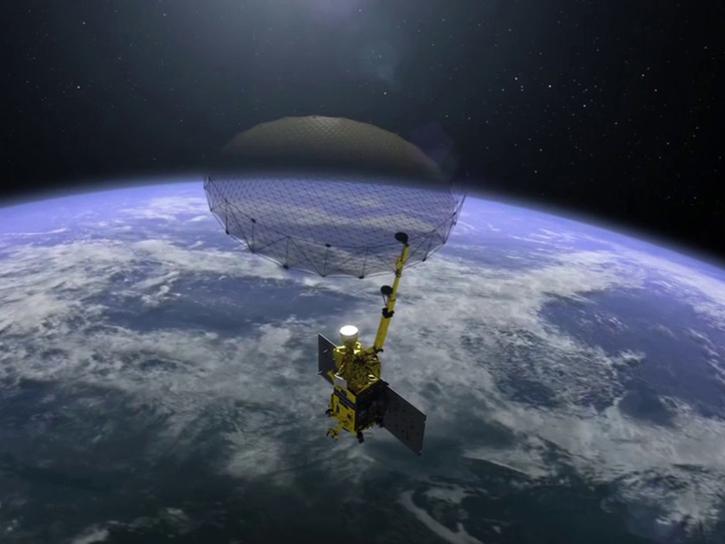
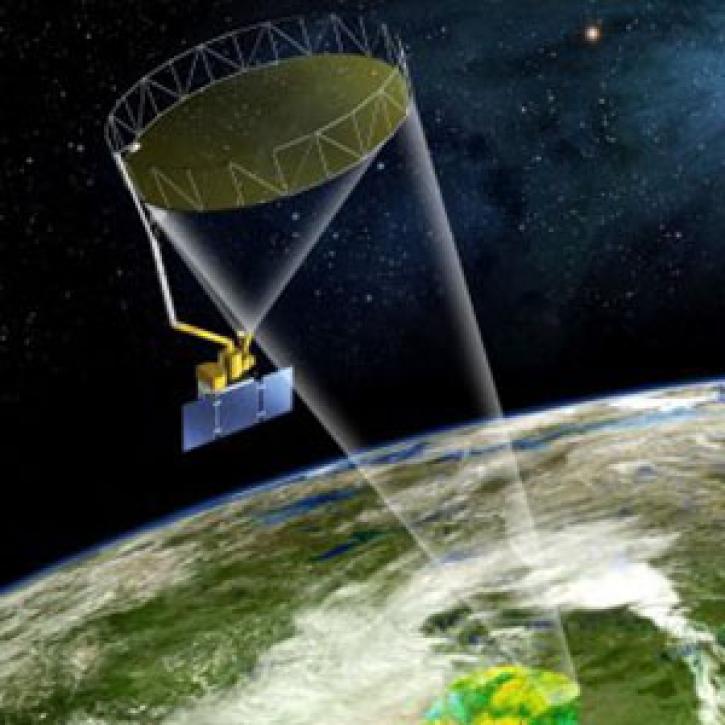
Featured Observation Method: SMAP
The Soil Moisture Active-Passive (SMAP) platform is a satellite that measures the surface moisture and freeze-thaw state of soil around the world approximately every three days. SMAP data contributes to understanding regional water cycles, ecosystem productivity, and natural processes involving water, energy, and carbon. SMAP's high-resolution data are helpful for weather, flood, and drought forecasting, and predicting agricultural productivity.
GIBS now has Soil Moisture Active Passive (SMAP) layers available for soil moisture and temperature, snow mass, heterotrophic respiration, and more.
This webinar will compare sea surface salinity data collected by the Aquarius and SMAP missions. We will showcase data visualization and data access tools available through NASA's Physical Oceanography Distributed Active Archive Center.
NASA's SMAP team turns raw satellite data into more than a dozen data products for data users around the world.
9 MIN READ
Feature article describing NASA's SMAP mission and the roles that ASF DAAC will play with distributing the SAR data.
Frequently Asked Questions
Earthdata Forum
Our online forum provides a space for users to browse thousands of FAQs about research needs, data, and data applications. You can also submit new questions for our experts to answer.
Submit Questions to Earthdata Forumand View Expert Responses