Reference Frame
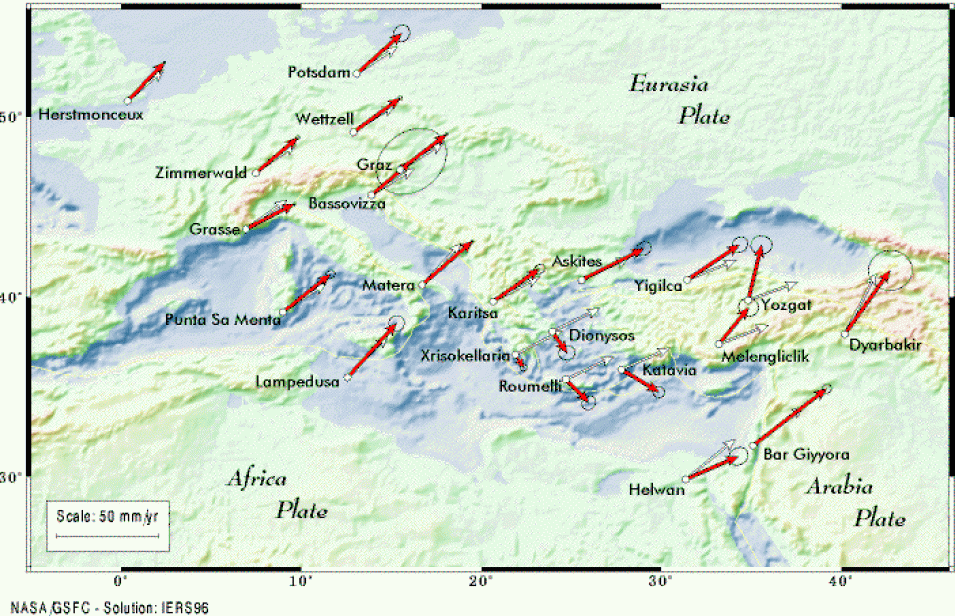
In this tectonic map, the horizontal components of tectonic motion that have been estimated from the Goddard Space Flight Center analysis of Satellite Laser Ranging (SLR) data are plotted as red vectors on this map. The blue vectors represent the motions for the sites as given by the NUVEL-1A geologically determined plate motion model. The frame within which these motions are placed is defined mathematically such that, in an integrated sense, there is no uniform net rotation remaining (called a "no net rotation" frame, or NNR frame). Please keep in mind that this is a mathematical idealization and that these motions only approximate the velocity relative to a fixed mantle.
Broad Description
Across Europe, most of the results from the SLR analysis exhibit northeastward motion on the order of 25 to 30 mm/yr (a little more than an inch per year). The uncertainties for the velocities range from better than ±2 mm/yr to ±20 mm/yr. These are shown as pink error ellipses centered at the tip of each vector. The size of these error ellipses is chiefly determined by the number of observations and length of time that the observations were taken.
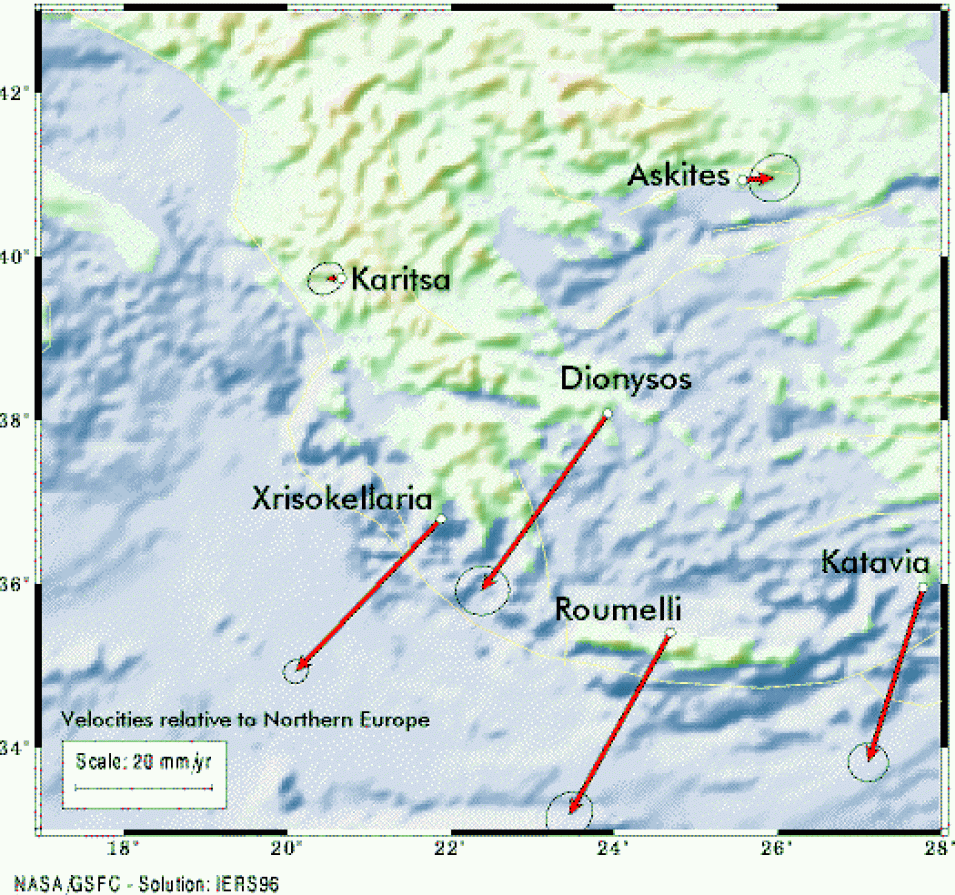
Note that the vectors in the Greek and Turkish regions are not very well aligned with those predicted by the NUVEL-1A model. This is due to rather dramatic deformational processes occurring across this region. You can get a better understanding of the deformation in this region via a simple thought experiment. Imagine a vector connecting the tip of a site's blue vector with the tip of its white vector. This imagined vector represents what the motion of the site would be relative to fixed Europe (this is not true for the three sites in the lower right hand corner of the map since the blue vectors for these sites represent motions of other plates). In other words, if you were to "nail down" the main body of Europe, these imagined vectors would represent the deformational motion relative to Europe. These are shown for the Aegean region in the figure below.

