Reference Frame
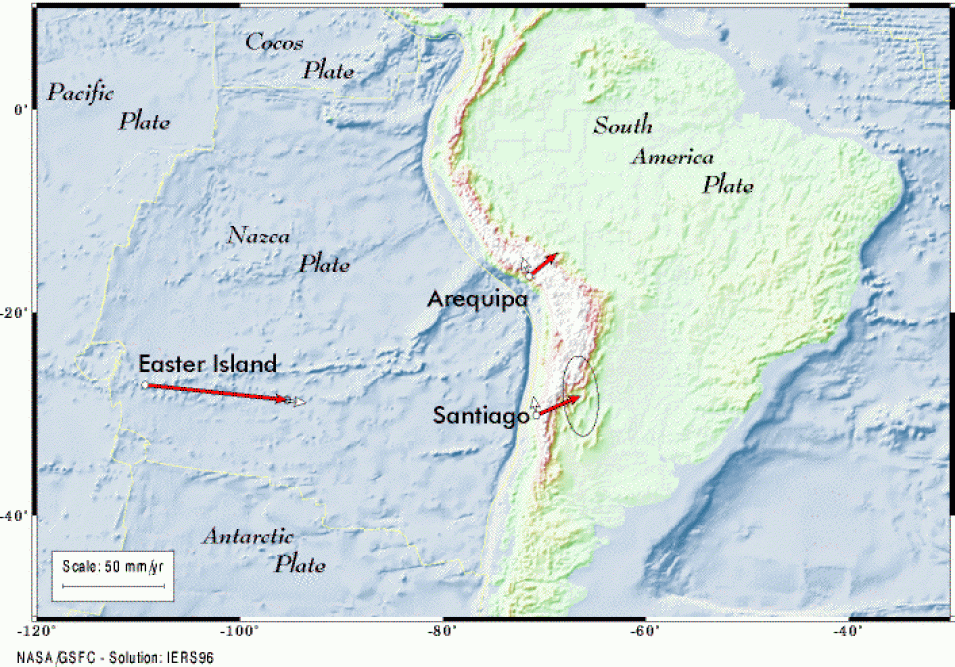
The horizontal components of tectonic motion that have been estimated from the NASA's Goddard Space Flight Center analysis of satellite laser ranging (SLR) data are plotted as white vectors on this map. The blue vectors represent the motions for the sites as given by the NUVEL-1A geologically determined plate motion model. The frame within which these motions are placed is defined mathematically such that, in an integrated sense, there is no uniform net rotation remaining (called a "no net rotation" frame, or NNR frame). Please keep in mind that this is a mathematical idealization and that these motions only approximate the velocity relative to a fixed mantle.
Broad Description
There are three SLR stations plotted on this map. They each are in interesting regions of the world.
Beginning with the site on Easter Island — which resides on one of the fastest moving plates, the Nazca plate — the SLR estimate of motion is generally slower than that expected from the NNR-NUVEL1A model. An explanation for this may be related to a possibility that there is a very gradual slowing of the some of the plate velocities over time. The NUVEL-1A model of plate motion is based on geological evidence — particularly, the "speed" of the plates — is derived from studying the patterns of a specific magnetic anomaly on the ocean floors. The anomaly used in the development of NUVEL-1A is approximately three million years old, thus, the rates implied by this anomaly a reaveraged over this time span of three million years.
On the other hand, the SLR data used to estimate site motions only spans about 15 years. If there is any slow-down (or speed-up) between these time spans, then we might expect to observe this in these results. There is some evidence of a small amount of slowing of the rate of the Pacific/Nazca boundary (along which are the fastest relative plate rates in the world) over the last three million years. This would provide one possible explanation for the slower SLR velocity at Easter Island.
The two sites in South America, Arequipa and Santiago, are located in the deforming collision boundary zone between the Nazca plate and the South America plate. The Nazca plate subducts beneath South America and, like the case at Simosato (see the Pacific Basin map), a portion of the subduction motion is being transferred into a portion of the overriding plate. This explains why the motions for these two sites appear deflected to the east relative to their modeled South America NN R-NUVEL1A motion.
