ESDIS Weekly Metrics: May 11, 2026

Image

Notes:

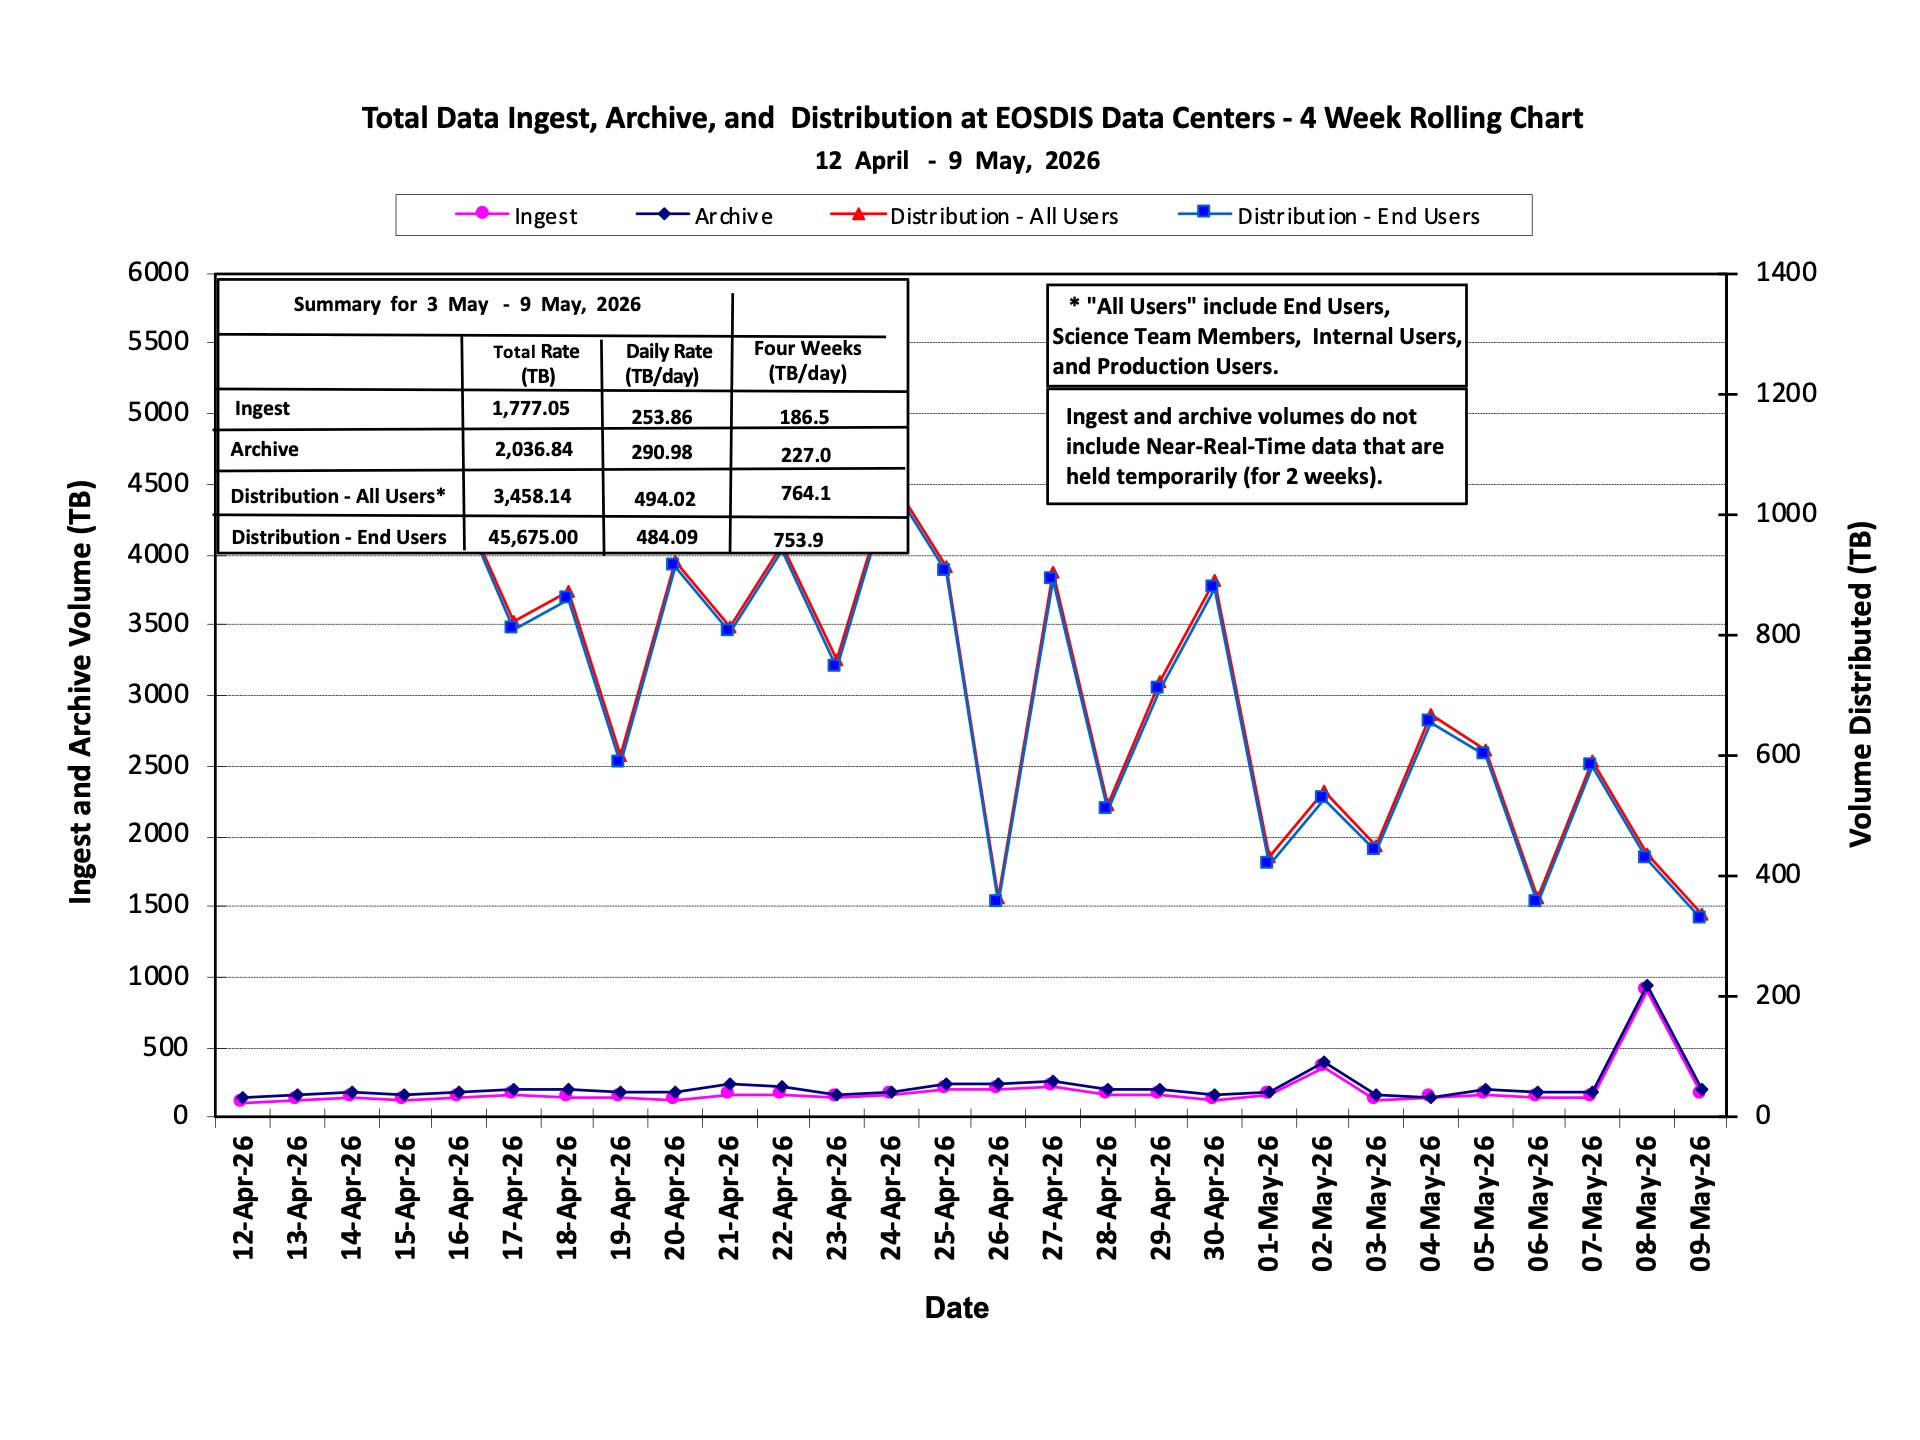
  1. The volume distributed to end users per day, as a running average over the past four weeks, is 3.321 times the volume added to the archive per day.
  2. The spike in distribution was caused by the download of the product SENTINEL-1A_SLC from ASFCLOUD.
Image

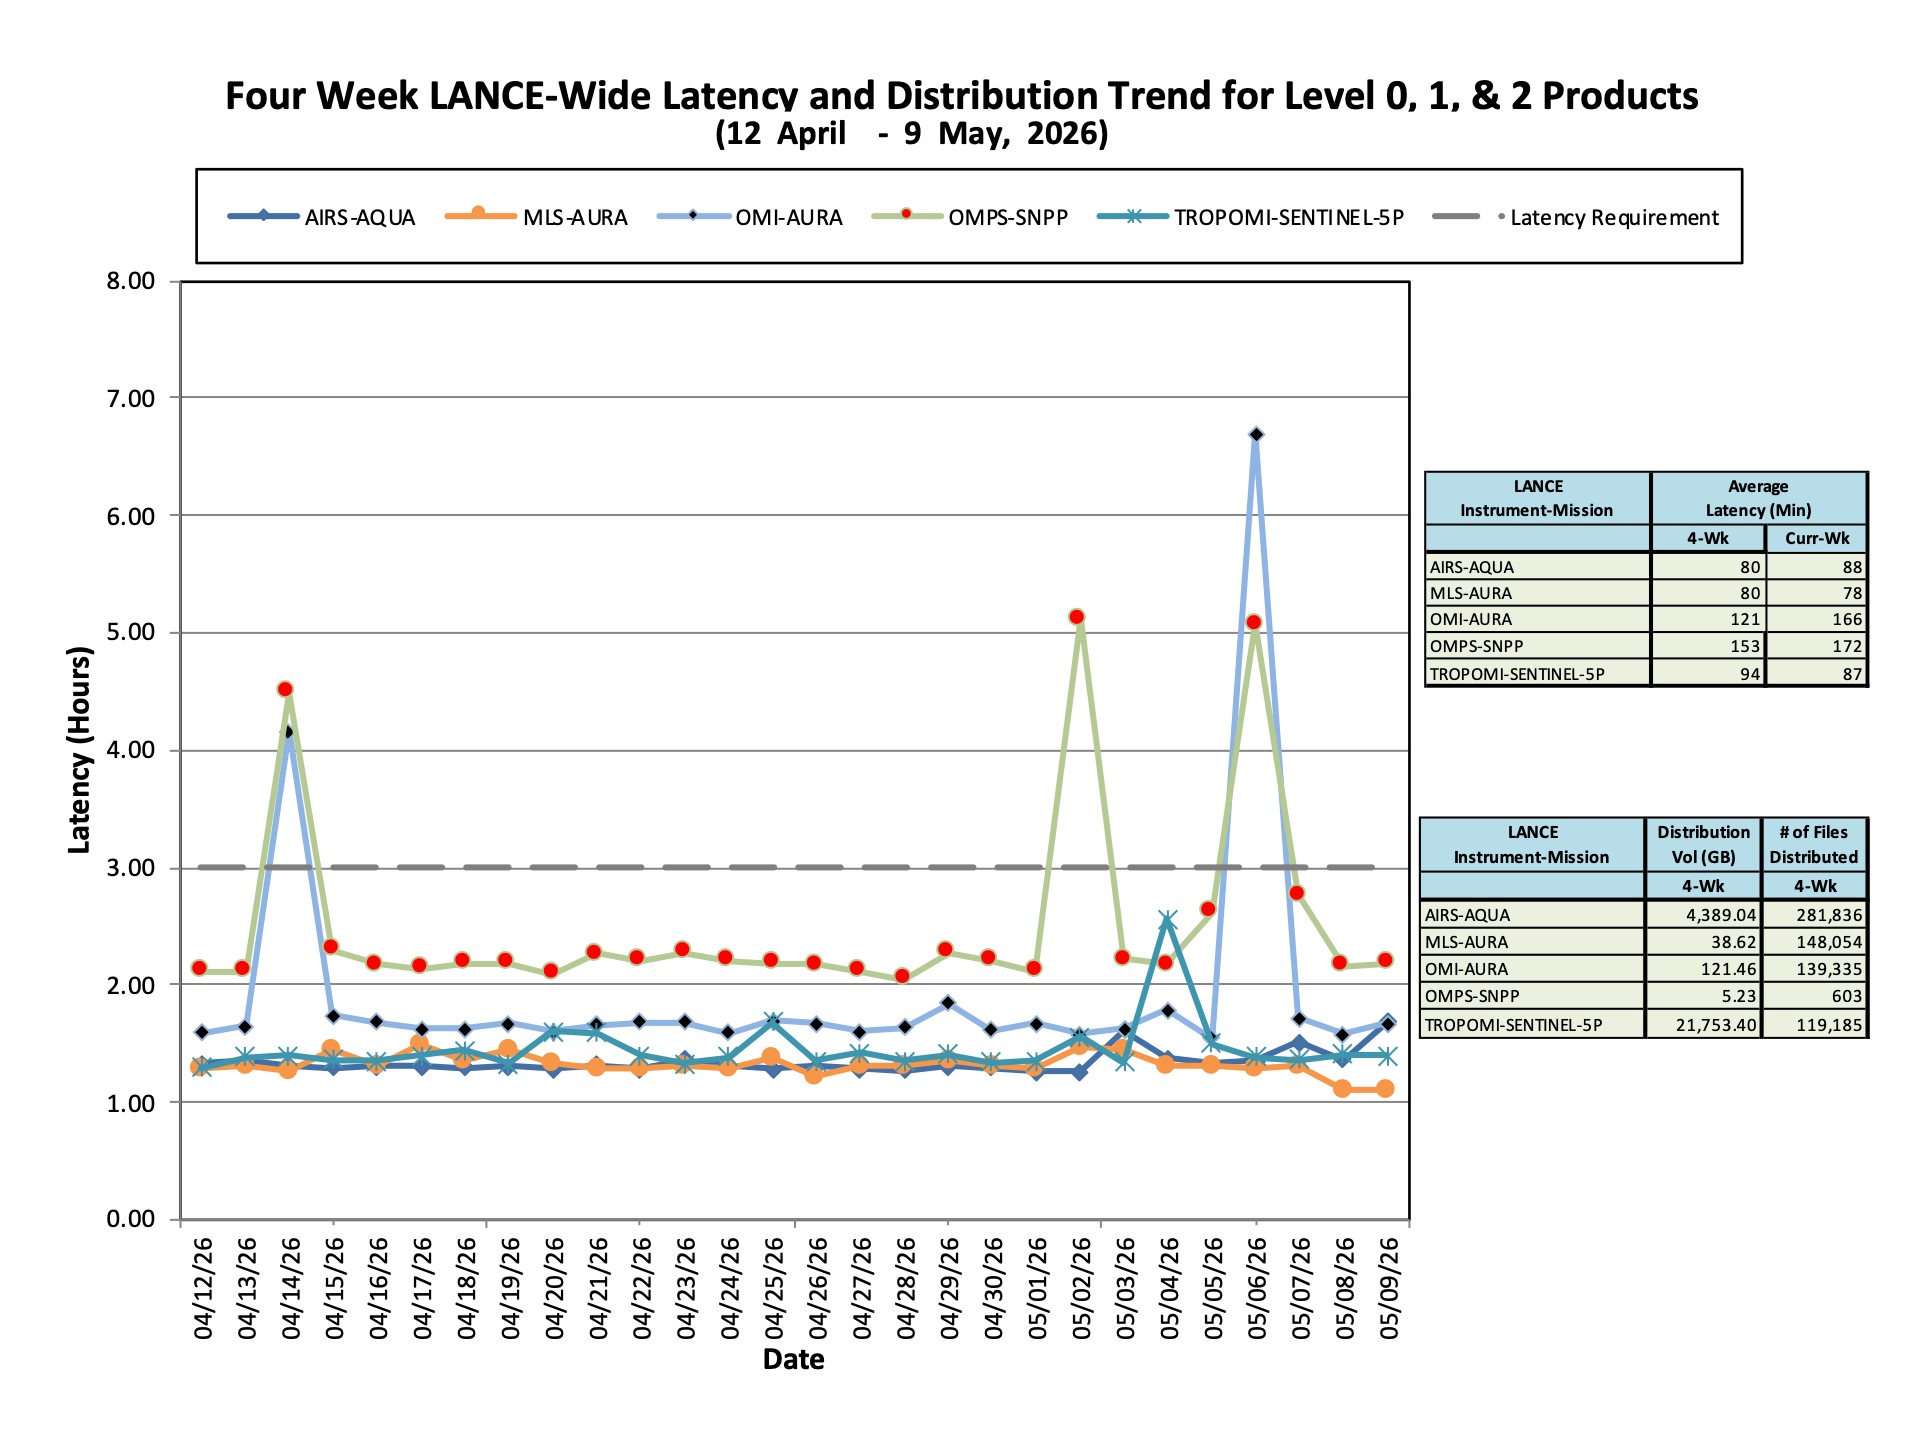
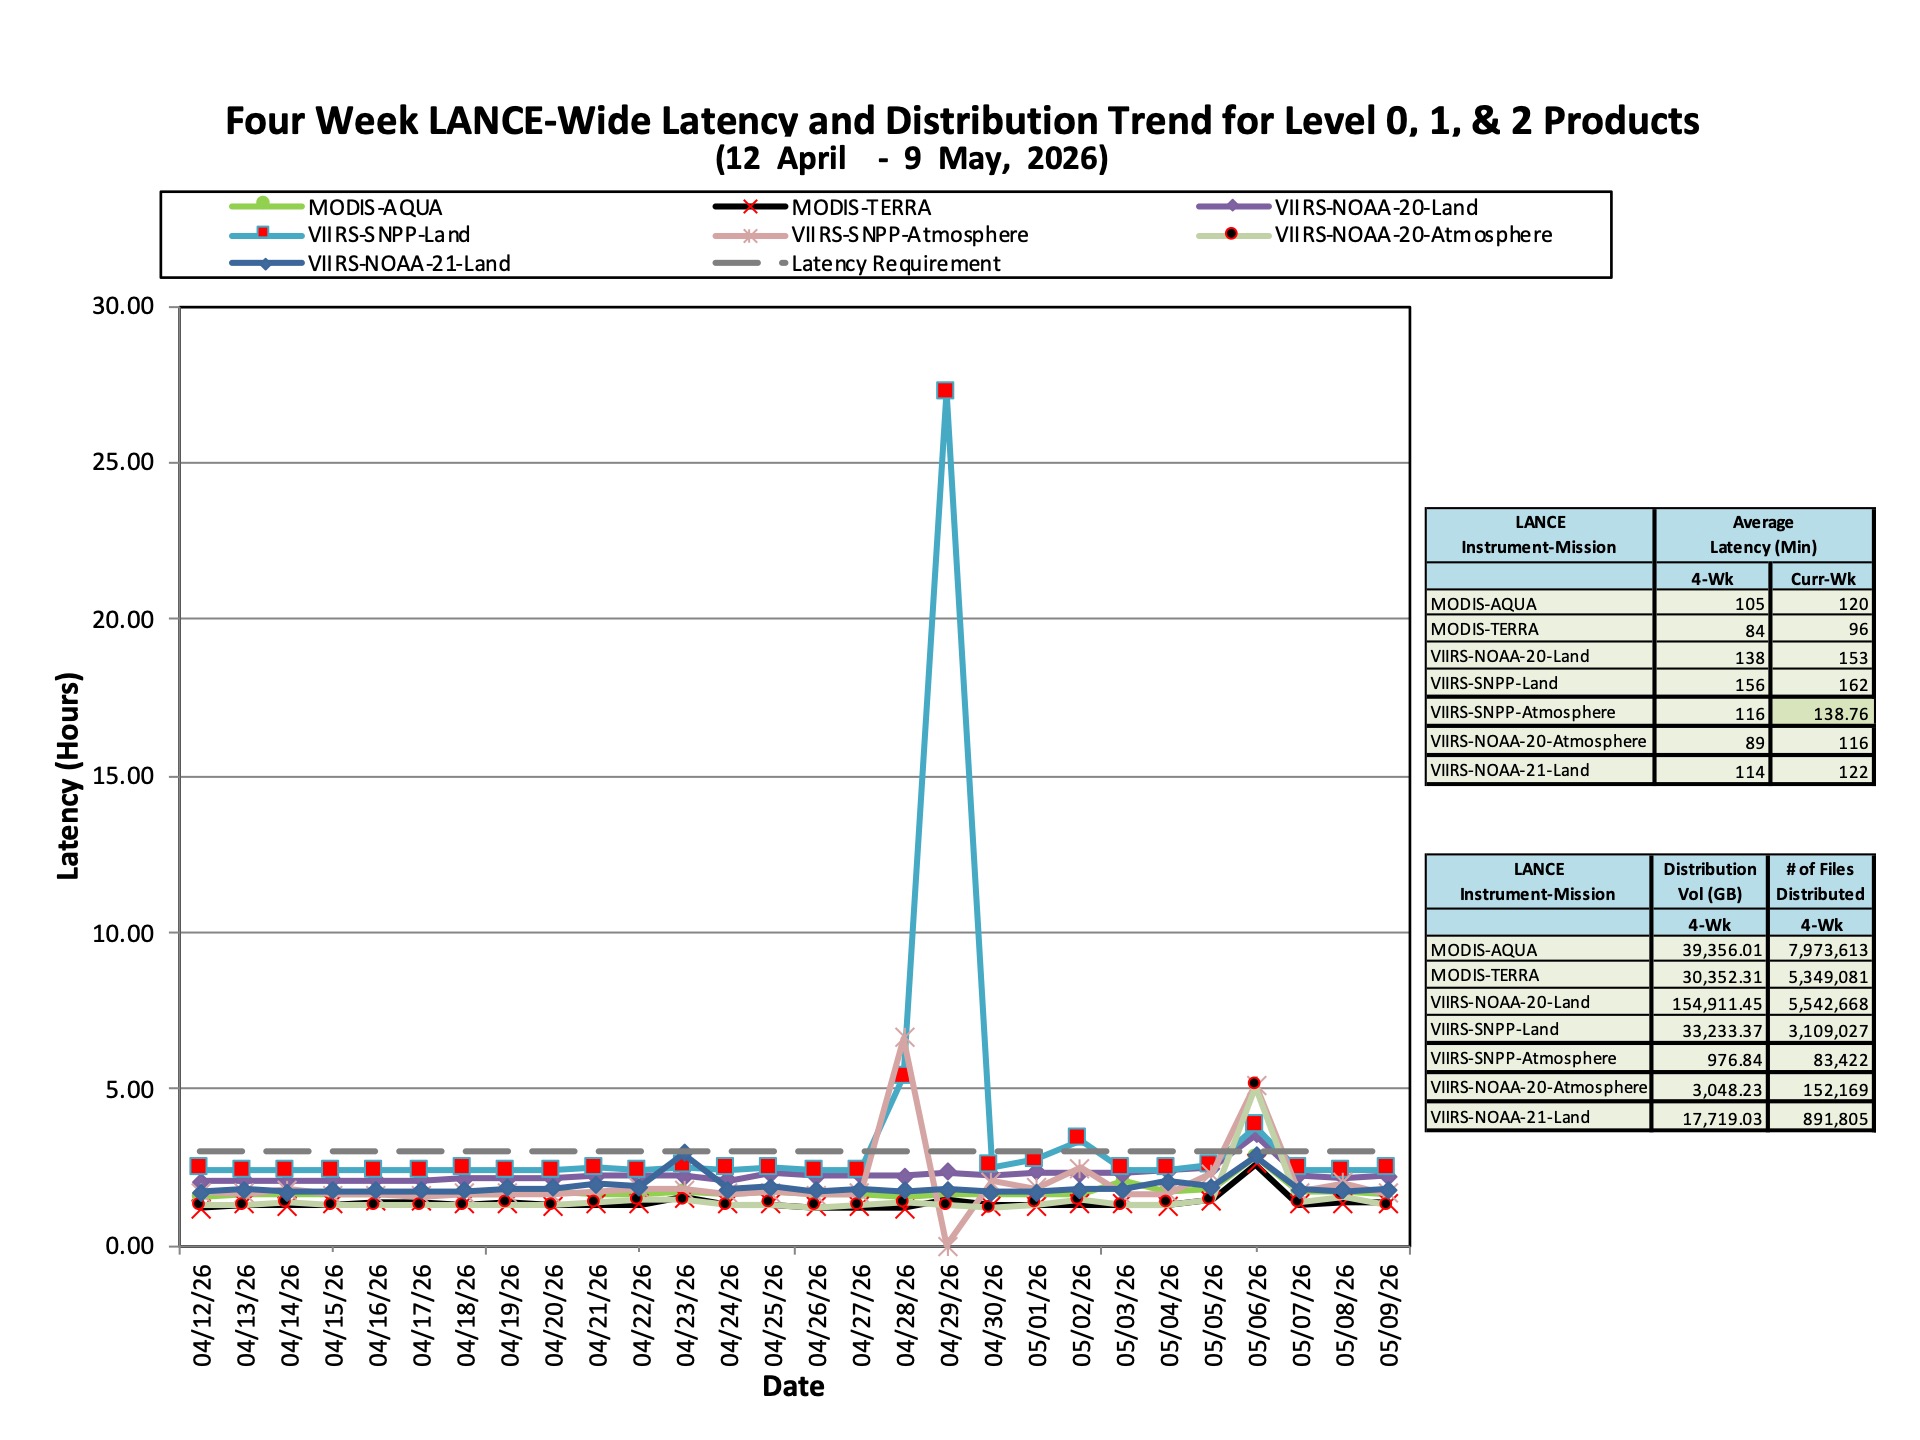
Note - Higher product latencies for:

  • VIIRS-NOAA-20-Atmosphere and VIIRS-SNPP-Atmosphere on May 6, 2026, were due to an unexpected systems outage.
  • VIIRS-NOAA-20-Land and VIIRS-SNPP-Land on May 6, 2026, were due to system maintenance.
Image

Note - Higher product latencies for:

  • OMI-AURA on May 6, 2026, were due to a production delay.
  • OMPS-SNPP on May 2 and May 6, 2026, were due to a production delay.
Image

Notes:

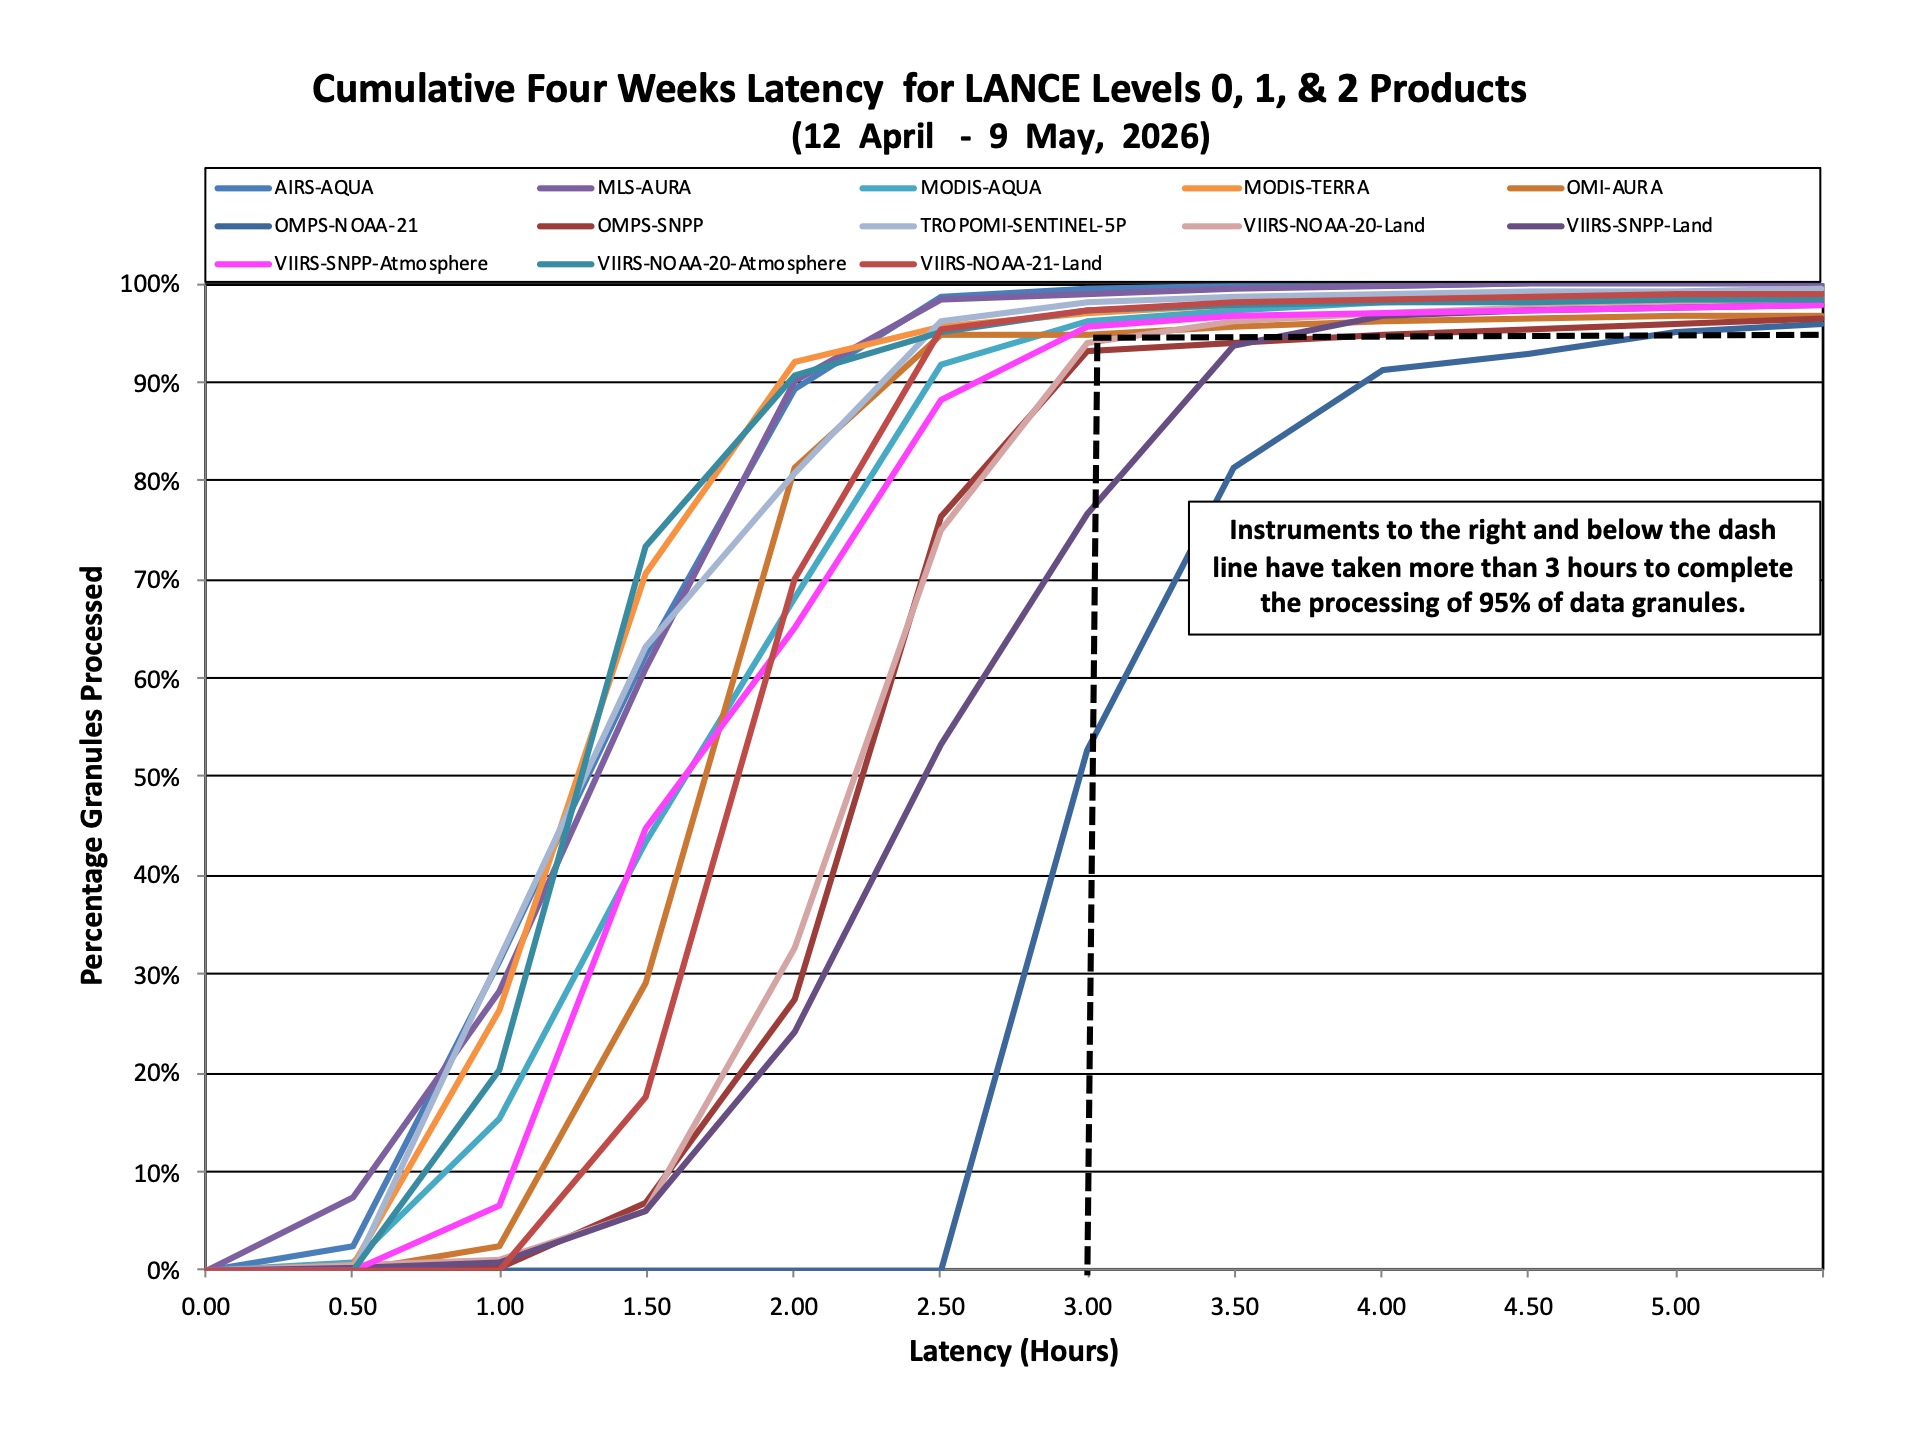
  1. Latency for a data granule is defined as the time taken from the midpoint between the start and end of acquisition of the data to the granule being ready on-line for users to download.  
  2. Duration covered by the data for a granule is defined differently for four different instruments (e.g., MODIS granules are 5 minutes long, while OMI NRT granules are 13 to 136 minutes long).
  3. Over the past four weeks, more than 95% of near-real time (NRT) data requests for nearly all instruments were satisfied within 3 hours. The exceptions were OMPS-NOAA-21, OMPS-SNPP, VIIRS-NOAA-20-Land, and VIIRS-SNPP-Land, which had rates of 53%, 93%, 94%, and 77%, respectively, of NRT data requests being satisfied within 3 hours.

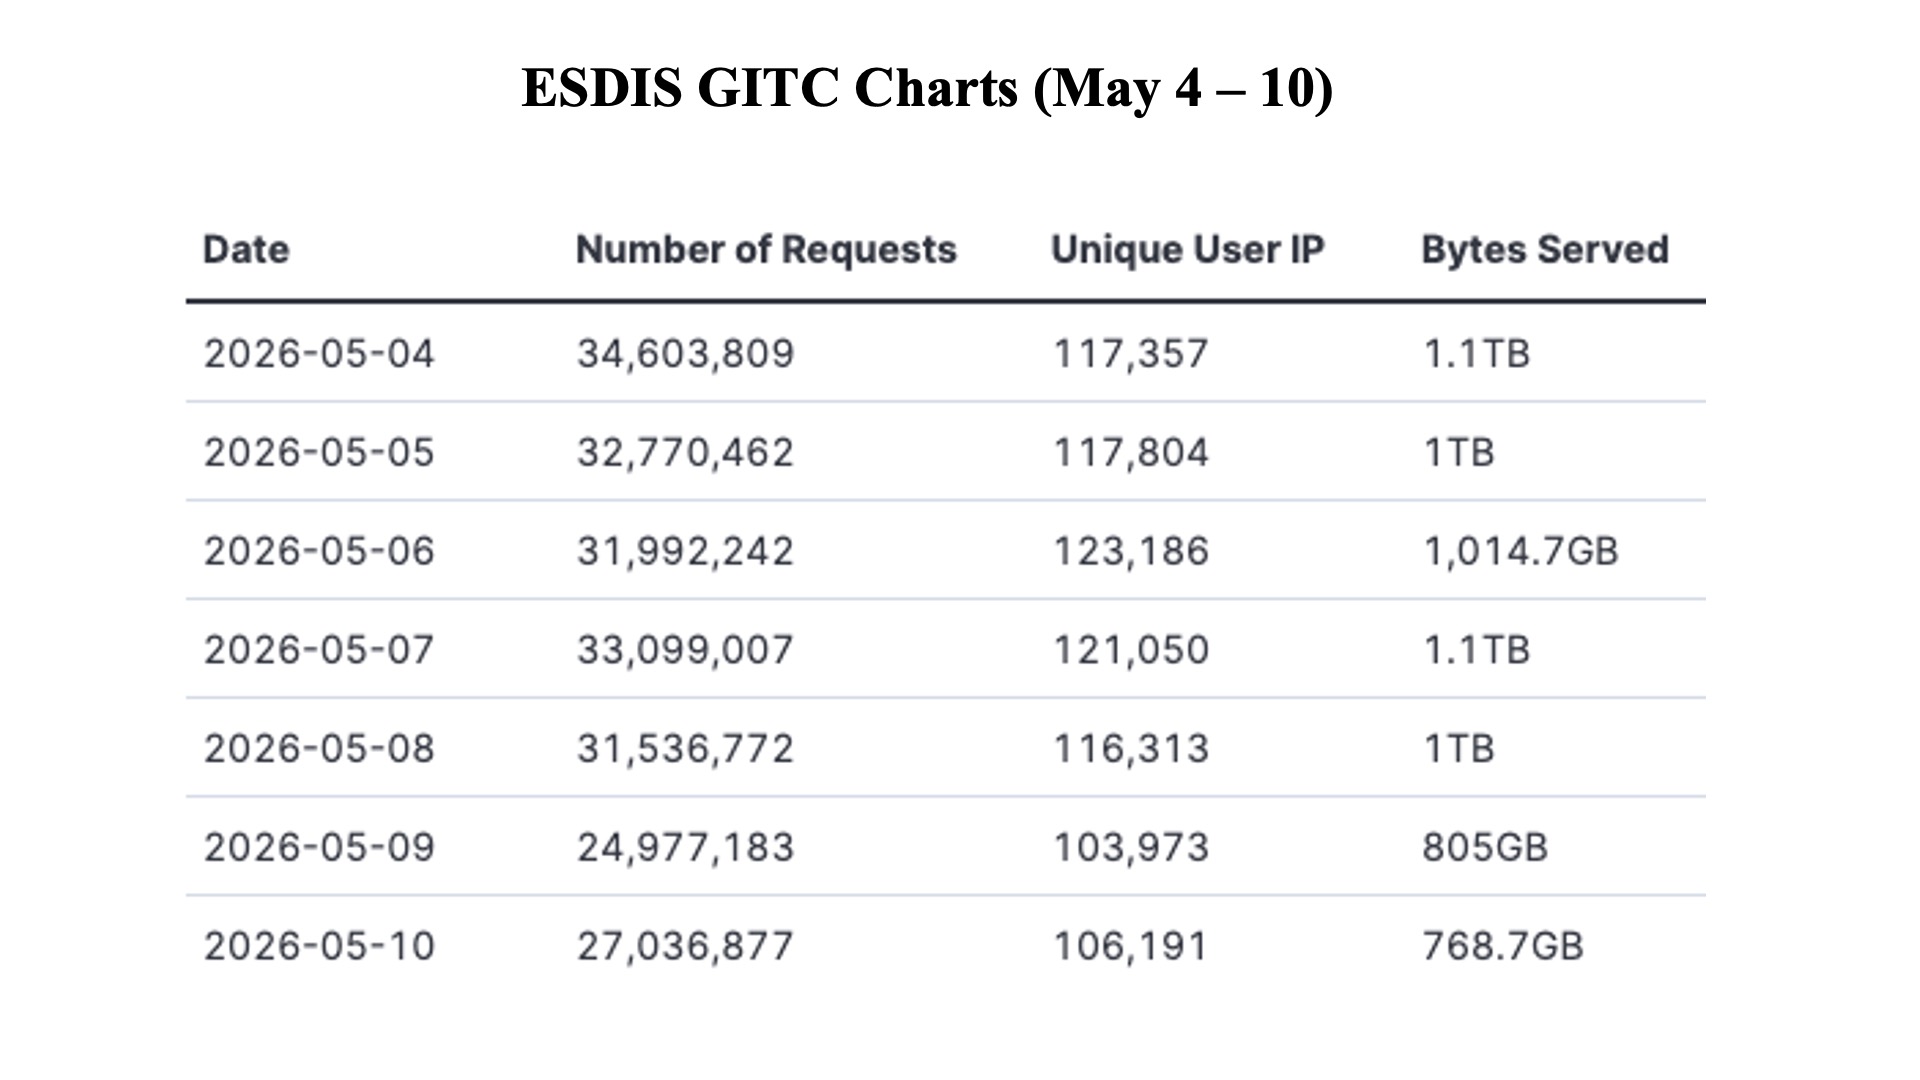
Gobal Imagery Browse Services (GIBS)

Image

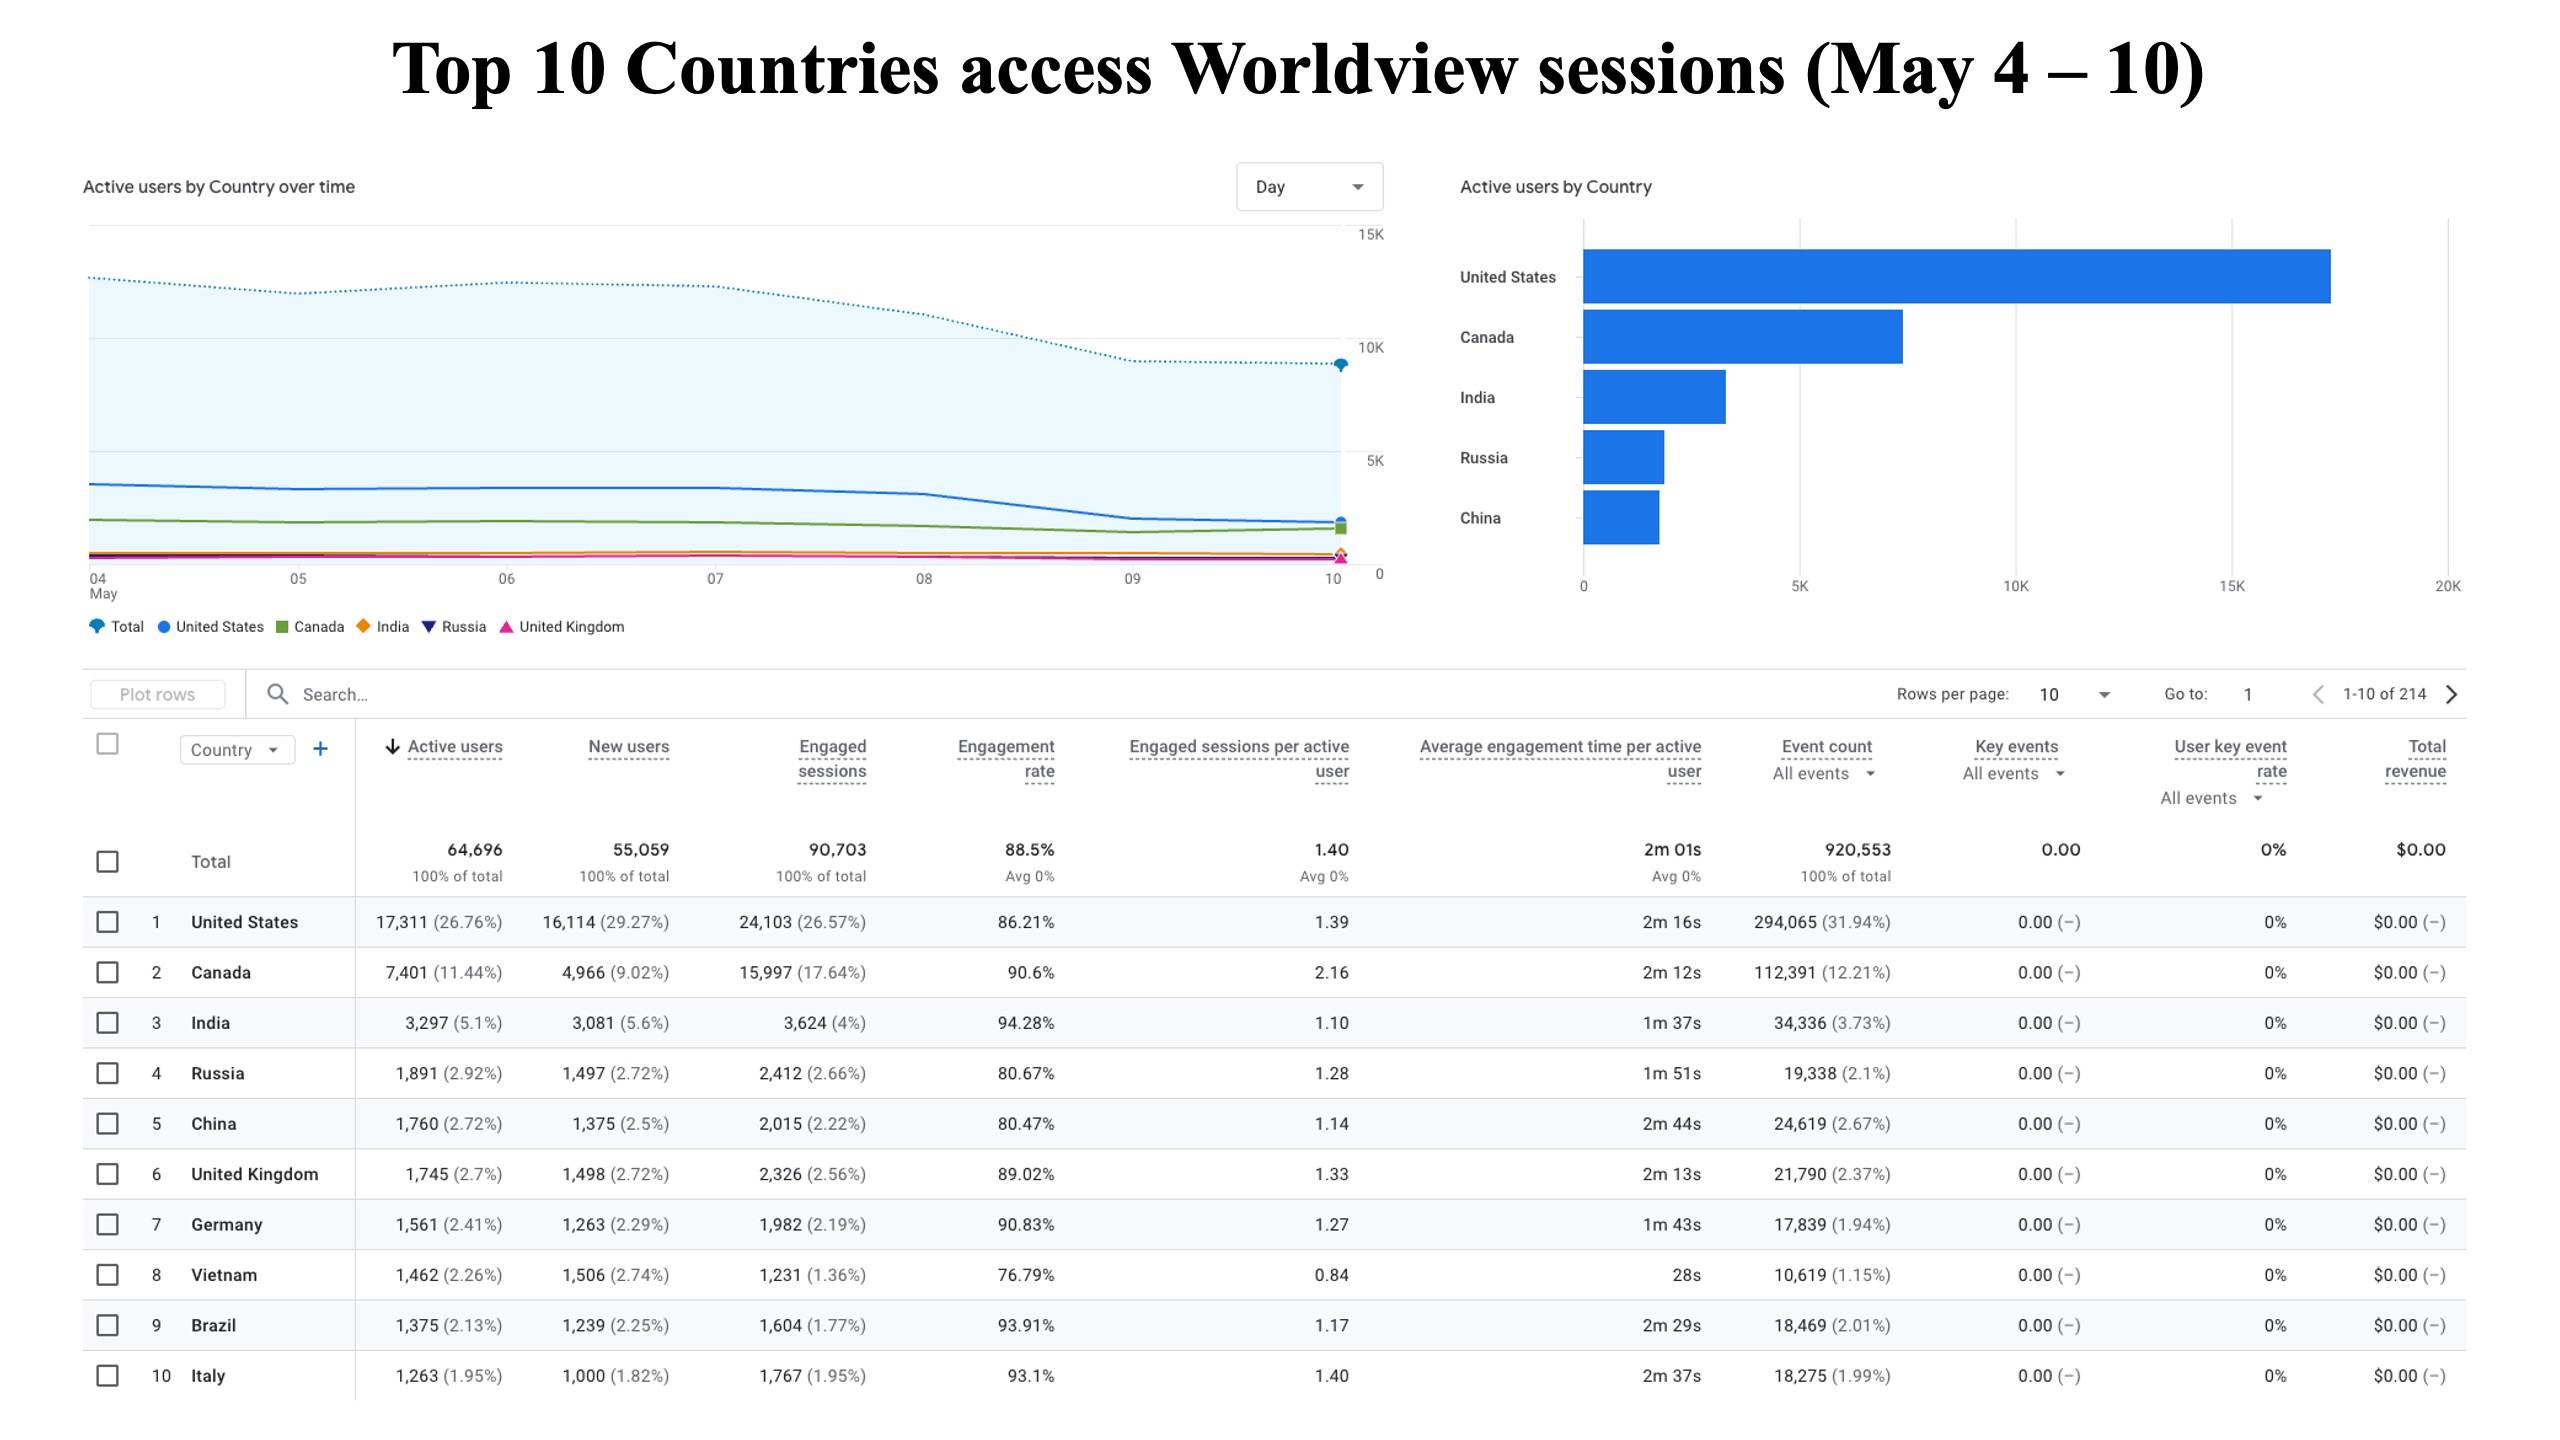
Worldview

Image