We are in the process of migrating all NASA Earth science data sites into Earthdata from now until end of 2026. Not all NASA Earth science data and resources will appear here until then. Thank you for your patience as we make this transition.
Read about the Web Unification Project
MOPITT SIPS Learning Resources
Webinars, tutorials, data recipes and more to help you work with MOPITT SIPS.
Filters

Understanding PACE-PAX's Multidimensional Approach to Validating PACE
StoryMap
Feb. 3, 2026

Join us on Wednesday, Jan. 30, at 2:30 p.m. ET to learn more about NASA's PREFIRE mission datasets, services, and tools.
Webinar
Jan. 16, 2026

Explore how the DCOTSS campaign braved storms to uncover changes in atmospheric composition.
StoryMap
Dec. 11, 2025

This StoryMap highlights the Aerosol Radiation Cloud aerosol Sea ice Interaction eXperiment (ARCSIX).
StoryMap
Dec. 8, 2025

This training will provide an overview of TEMPO capabilities and available trace gas data products, and illustrate how TEMPO data can be visualized.
Training
Jan. 20-22, 2026
Showcasing How the CALIPSO-NVF Campaign Validated the Extended Data Collection of the CALIPSO Satellite
StoryMap
Nov. 13, 2025
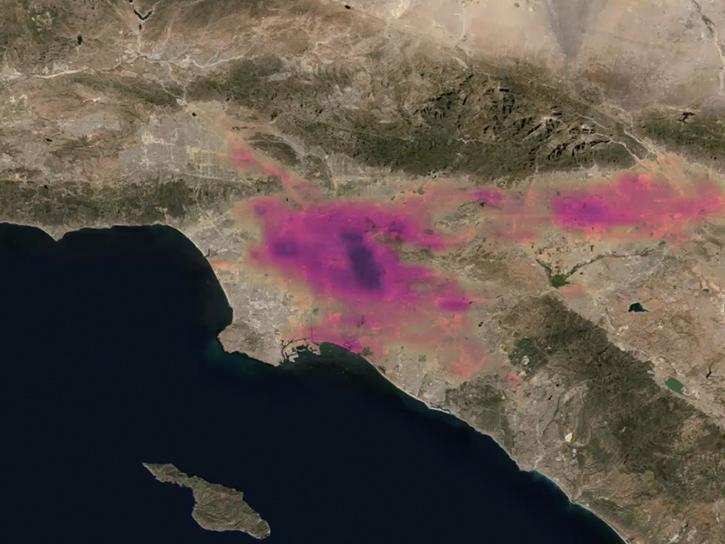
Understanding and Visualizing NO2 and HCHO Data from the STAQS and TEMPO Missions
StoryMap
Sept. 24, 2025
Join NASA's Prediction Of Worldwide Energy Resources (POWER) team for a virtual Global Community Summit Sept. 9-10, 2025, to learn about POWER, exchange insights, and to explore new opportunities to support user communities.
Event
Aug. 6, 2025
SHOWING 8 OF 50