Introduction

Data products distributed by the Land Processes Distributed Active Archive Center (LP DAAC) are used in many different Earth science applications. They play an important role in modeling, helping to detect changes to the landscape, and assessing ecosystem variables, to name a few. Three of those applications, published between July and September 2018, are highlighted below.

Phenology Shifts in Thai Forests

Moderate Resolution Imaging Spectroradiometer (MODIS) Normalized Difference Vegetation Index (NDVI) and elevation data are used to assess growing season shifts in Thailand's tropical forests during El Niño and La Niña events.

Image
Image Caption

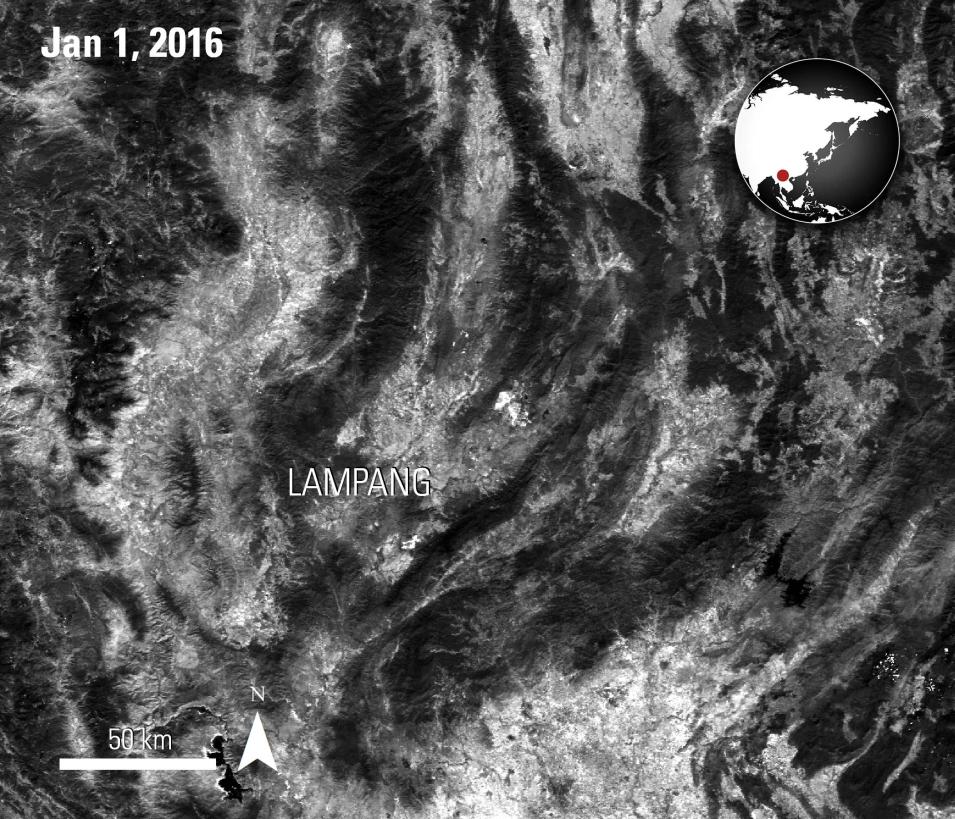
Lampang, Thailand and the surrounding area is visualized using band 1 of this Terra MODIS Surface Reflectance data product. Diem and others (2018) used bands 1 (red) and 2 (near-infrared) of this data product to calculate NDVI, which was used to assess phenological changes in the study area from 2001 to 2016.

Science Objectives

An understanding of how forests respond to extreme climate events is important to the development of adaptation strategies for forest conservation. This study, described in the paper "Shifts in growing season of tropical deciduous forests as driven by El Niño and La Niña during 2001–2016" published in Forests, focuses on how extreme climate events affected the timing and duration of the growing season of two tropical deciduous forest types in northern Thailand during El Niño and La Niña years. A combination of in-situ data, satellite-based vegetation metrics, and local climate variables are used to assess phenological changes in the study area from 2001 to 2016.

Instruments Used

NDVI is used to derive information on the start of the growing season, end of the growing season, and length of the growing season, which are important indicators of vegetation response to climate changes. Diem and others (2018) calculate NDVI from MODIS Surface Reflectance data product (MOD09Q1) using the red and near-infrared bands. Landsat 8 Operational Land Imager (OLI) data are also used to classify land cover types, and elevation values from the NASA Shuttle Radar Topography Mission (SRTM) version 3 digital elevation model (DEM) data product (SRTMGL1) are used to apply topographic corrections.

Major Findings

The results of the study found that precipitation and temperature anomalies associated with El Niño and La Niña affected the response of phenological metrics in these tropical deciduous forests. The authors found a delay in the start of the growing season during El Niño, and contrarily, an advance to the start of the growing season during La Niña, which could potentially have an impact on forest health and the ecosystem services these forests provide. The authors note that tropical deciduous forests may become increasingly vulnerable if more frequent and intense extreme climate events occur; however, we have a chance to improve mitigation strategies to reduce risk of harm to forest health given a more thorough understanding of how these forests might respond.

References

Publication Reference

Diem, P. K., Pimple, U., Sitthi, A., Varnakovida, P., Tanaka, K., Pungkul, S., Leadprathom, K., LeClerc, M., and Chidthaisong, A., 2018, Shifts in growing season of tropical deciduous forests as driven by El Niño and La Niña during 2001–2016: Forests, v. 9, no. 8, p. 448. doi:10.3390/f9080448

Image References

Granule ID
  • MOD09Q1.A2016001.h27v07.006.2016011194800
DOI
  • 10.5067/MODIS/MOD09Q1.006

Land Degradation Risk in Cyprus

Advanced Spaceborne Thermal Emission and Reflection Radiometer (ASTER) elevation data and environmental indices are used to identify areas vulnerable to degradation on the Mediterranean island of Cyprus.
Image
Image Caption

The Terra ASTER GDEM data product is used here to show the variations in elevation of Cyprus. The authors used this data product to derive aspect, which is a required input parameter to the Climate Quality Index.

Science Objectives

Land degradation is a major problem worldwide that has many consequences, including soil erosion, water pollution, and loss of soil structure. This study, described in the paper "Detection of areas susceptible to land degradation in Cyprus using remote sensed data and environmental quality indices" published in Land Degradation and Development, sought to detect areas in Cyprus that were vulnerable to land degradation between 2000 and 2016 using a combination of remotely sensed data and demographic information.

Instruments Used

Kolios and others (2018) calculate four quality indices (Climate Quality Index, Demographic Index, Soil Quality Index, and Vegetation Quality Index) before combining them into the Environmental Sensitivity Area Index (ESAI), which provides information on environmental risk of the land. The authors use ASTER Global Elevation Model Version 2 (ASTGTM) data product to calculate aspect, an input parameter to the Climate Quality Index. Other data are used to determine risk of land degradation, including Landsat and population density from the Gridded Population of the World data product.

Major Findings

The results of the ESAI showed that 9.68 percent of Cyprus is at risk of land degradation, including around the Troodos Mountain, one of the most vegetated areas of the island. The authors note that the exclusive use of remotely sensed data products for this regional analysis was an innovative approach and was useful in providing essential information to determine environmental risk.

References

Publication Reference

Kolios, S., Mitrakos, S., and Stylios, C., 2018, Detection of areas susceptible to land degradation in Cyprus using remote sensed data and environmental quality indices: Land Degradation and Development, v. 29, no. 8, p. 2338–2350. doi:10.1002/ldr.3024

Image References

Boundary Source

Global Administrative Unit Layers (GAUL) dataset, implemented by FAO within the CountrySTAT and Agricultural Market Information System (AMIS) projects.

Granule IDs
  • ASTGTM2_N34E032
  • ASTGTM2_N34E033
  • ASTGTM2_N34E034
  • ASTGTM2_N35E032

Crop Yield Forecasting in Eastern Europe

MODIS NDVI data and SRTM elevation data are used to forecast wheat and maize yields in the Tisza River catchment.

Image
Image Caption

The lowlands of the Tisza River catchment are visualized in this Terra MODIS NDVI image. In this study, NDVI was used to identify croplands and to forecast crop yield.

Science Objectives

Many studies have shown that satellite data are very useful in agricultural studies, such as providing information about crop type and health conditions. In this paper, "Wheat and maize yield forecasting for the Tisza River catchment using MODIS NDVI time series and reported crop statistics" published in Computers and Electronics in Agriculture, Nagy and others (2018) focused on developing and testing an early season wheat and maize yield forecasting tool in the lowlands of the Tisza River catchment in Central Eastern Europe.

Instruments Used

The authors use a timeseries (2000–2015) of the Normalized Difference Vegetation Index (NDVI) layer from MODIS Vegetation Indices data product (MOD13Q1) to map the locations of wheat and maize in the study area and to forecast yield. Elevation data from the NASA SRTM version 3 digital elevation model (DEM) data product (SRTMGL1) is also used to derive a crop mask along with CORINE (COoRdinate INformation on the Environment) Landcover datasets. The authors derive the yield forecasts using a simple linear regression analysis comparing NDVI values with officially reported wheat yield.

Major Findings

The results showed an agreement between wheat yield derived from MODIS NDVI data and reported wheat yield. The authors concluded that the forecasting method developed in this study performed acceptable in predicting wheat and maize yields; however, it is less reliable in the case of extreme drought or extreme precipitation. The authors concluded that the forecasting method needs further development but confirmed the usefulness of remotely sensed data products in achieving this.

References

Publication Reference

Nagy, A., Féher, J., and Tamás, J., 2018, Wheat and maize yield forecasting for the Tisza River catchment using MODIS NDVI time series and reported crop statistics: Computers and Electronics in Agriculture, v. 151, p. 41–49. doi:10.1016/j.compag.2018.05.035

Image References

Boundary Source

Global Administrative Unit Layers (GAUL) dataset, implemented by FAO within the CountrySTAT and Agricultural Market Information System (AMIS) projects.

Granule ID
  • MOD13Q1.A2015241.h19v04.006.2015305210138
DOI
  • 10.5067/MODIS/MOD13Q1.006

Details

Last Updated

June 3, 2025

Published

Oct. 25, 2018

Data Center/Project

Land Processes DAAC (LP DAAC)