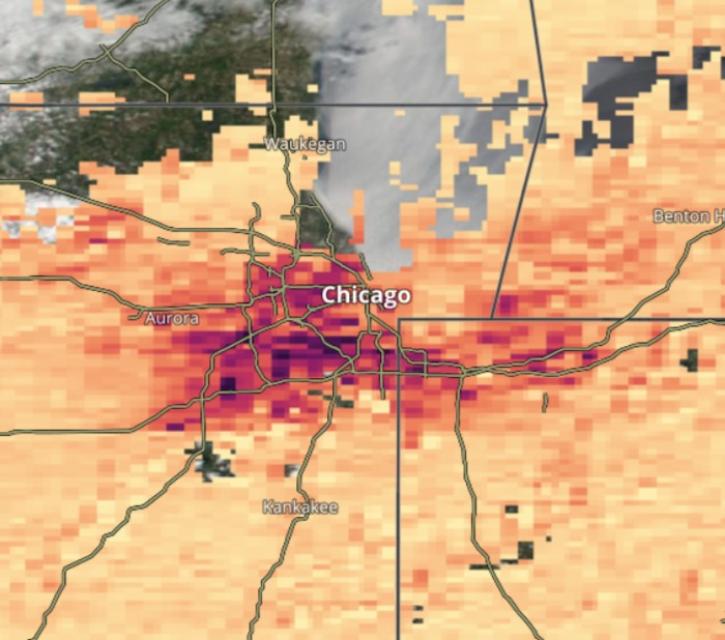
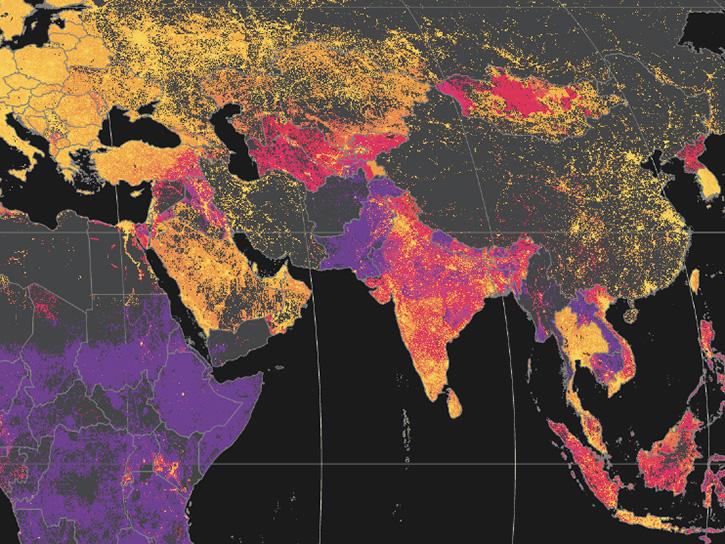
Air pollution is one of the largest global environmental and health threats. Instruments aboard NASA satellite and airborne platforms continually acquire data about these pollutants.
Image
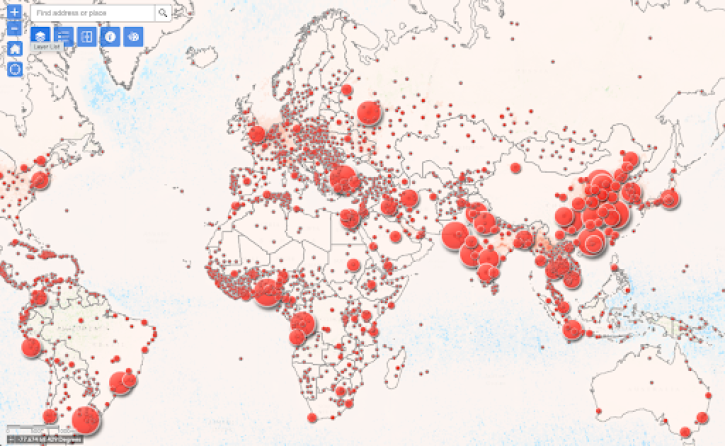
Air quality is a global issue as seen here in cities around the world. Credit: National Center for Atmospheric Research (NCAR).
This Data Pathfinder is designed to help guide you through the process of selecting and using datasets applicable to health and air quality, with guidance on resolutions and direct links to the data sources. If you are new to remote sensing, the What is Remote Sensing? Backgrounder provides a good overview. In addition, NASA's Applied Remote Sensing Training Program (ARSET) provides numerous training modules, including Fundamentals of Remote Sensing.
If you have specific questions about how to use data, tools, or resources mentioned in this Data Pathfinder, please visit the Earthdata Forum. Here, you can interact with other data users and NASA subject matter experts on a variety of Earth science research and applications topics.
An Overview of Health and Air Quality
The causes of air pollution vary from human activities (such as coal-fired power plants) to natural events (like wildfires and dust storms). While the U.S. is fortunate to have provisions for numerous ground-based measurements for assessing air quality and the concentrations of different types of atmospheric pollution, this is not the case in other countries (or even in some regions of the U.S.). Since air pollution is a global hazard, a combination of airborne, ground, and satellite-based tools is necessary to better understand the movement of pollutants and the impact of events leading to poor air quality.
Satellite-acquired data have many health and air quality applications, including:
Monitoring the movement of wildfire smoke and dust plumes
Tracking the path of ash from volcanic eruptions
Identifying concentrations of nitrogen dioxide (NO2), sulfur dioxide (SO2), and other pollutants near cities, suburbs, and major transportation systems
Understanding how concentrations of these pollutants are changing over time
To learn more about these applications, see the Getting Started Resource produced by NASA’s Health and Air Quality Applied Sciences Team (HAQAST). Additional articles explaining how how NASA data are being used to investigate the health impacts of air pollution include:
NASA collaborates with other federal entities and international space organizations to collect and distribute air quality data, all of which are available without restriction. Many NASA data products provide information on primary (directly emitted) and secondary pollutants (formed by chemical reactions), some of which can serve as precursors to other types of air pollution.
Datasets referenced in this pathfinder are from satellite and airborne sensors shown in the table below, including their spatial and temporal resolutions. Note that many satellites/platforms carry multiple sensors; the table below only lists the primary sensor used in collecting the specified measurement. When available, NASA's Land, Atmosphere Near real-time Capability for EOS (LANCE) provides data within three hours of a satellite observation, which allows for near real-time (NRT) monitoring and decision making.
Note: This is not an exhaustive list of datasets related to air quality measurements, and only includes datasets in NASA's Earth Observing System Data and Information System (EOSDIS) collection.
Satellite measurements of aerosols, called aerosol optical thickness, are based on the fact that the particles change the way the atmosphere reflects and absorbs visible and infrared light. AOD data can be integrated with ground-based data to estimate PM2.5.
Trace gases, like nitrogen dioxide, carbon monoxide, etc., are released to the atmosphere through human actions, such as the burning of fossil fuels. Upon inhalation, these gases can cause respiratory issues, making breathing more difficult, as well as exacerbate other conditions, such as asthma and diabetes.
Satellites offer one of the best options for monitoring the size, opacity, and movement of pollutants, like dust and smoke. Large plumes can lead to poor air quality for surrounding areas.
Socioeconomic data on population density, poverty, mortality, etc. coupled with NASA pollutant data provides insight into vulnerable communities with the goal of developing strategies to mitigate risk and exposure to these communities.
Exposure to air pollution (indoor and outdoor) is responsible for about 1 in 9 deaths worldwide. Researchers are using NASA data in combination with public health data to mitigate risks to vulnerable communities.
Use the Data
Image
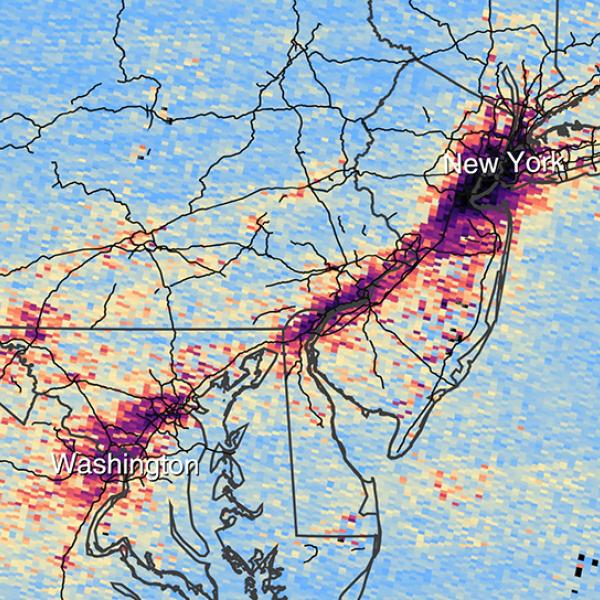
Left image: Particulate pollution can be assessed qualitatively using visual imagery, as in this Terra/MODIS image of smoke from the Camp Fire acquired in November 2018. Right image: Particulate matter and trace gases can be measured quantitatively through atmospheric column products, such as in this image showing average concentrations of nitrogen dioxide along the U.S. East Coast. Credit: NASA Worldview (left image); NASA Science Visualization Studio (right image).
There are three main ways to use satellite data: for qualitative applications, for quantitative applications, and for more advanced analysis. To review these three applications in more detail, view NASA's Health and Air Quality Applied Sciences Team (HAQAST) Getting Started Resource.
For qualitative understanding, satellite images provide information about spatial patterns, atmospheric transport, and trends in air pollution
For quantitative analysis, satellite data can be used to quantify change and relative abundance of pollutants
Beyond qualitative and simple quantitative calculations, satellite data support a wide range of advanced analysis, especially when combined with complementary data sources (such as socioeconomic data)
Monitoring air quality provides a means to visualize trends, forecast events or movement of pollutants, and respond to events. The following use cases show the many uses of remotely sensed data for observing health and air quality:
NASA's Applied Remote Sensing Training Program (ARSET) offers satellite remote sensing training that builds the skills to integrate NASA Earth science data into decision-making activities. ARSET has numerous air quality webinars.
Two upcoming satellite missions will focus on pollutants in Earth's atmosphere:
NASA's Multi-Angle Imager for Aerosols (MAIA) investigation will seek to understand how different types of air pollution affect human health
NASA's Tropospheric Emissions: Monitoring of Pollution (TEMPO) mission will be a geostationary mission to measure lower tropospheric concentrations of a wide range of pollutants
NASA's Air Quality Citizen Science is a citizen science program funded by the NASA's Earth Science Data Systems (ESDS) Program to add value to aerosol optical depth (AOD) measurements obtained by sensors aboard NASA's Aqua and Terra satellites. Citizen scientists are helping create a network of high quality, "low-cost" sensors in Los Angeles, California; Raleigh, North Carolina; and Delhi, India.
Citizen-Enabled Aerosol Measurements for Satellites (CEAMS) is an ESDS-funded citizen science program to improve our understanding of how aerosols affect local air quality. Citizen scientists take backyard air quality measurements using Sun photometers.
NASA's Short-term Prediction Research and Transition Center (SPoRT) is a project to transition unique observations and research capabilities to the operational weather community to improve short-term forecasts on a regional scale. SPoRT provides access to numerous near real-time datasets that provide information on dust transport. The SPoRT dust guide provides information on dust imagery and interpretation.
My NASA Data is an effort to develop learning modules of Earth science data that are accessible, interesting, and useful to the K-12 and citizen scientist communities. My NASA Data's Earth System Data Explorer is a data visualization tool in which the data already have been cataloged and formatted so that data maps can be easily plotted.
Global Air Quality is an Esri StoryMap that shows 19 years of airborne particulate matter.
State of the Global Air, developed as part of the Institute for Health Metrics and Evaluation’s (IHME) annual Global Burden of Diseases, Injuries, and Risk Factors Study (GBD), provides an interactive tool to view and compare the latest air pollution and health data, create custom maps and graphs, and download the images and data.
Global Burden of Diseases, Injuries, and Risk Factors Study, out of the Institute for Health Metrics and Evaluation (IHME), is an independent population health research center at the University of Washington that provides rigorous and comparable measurement of the world's most important health problems and evaluates the strategies used to address them.
Connection of Sustainable Development Goals to Health and Air Quality
The Sustainable Development Goals (SDGs) are a collection of 17 interlinked global goals designed to be a blueprint for a sustainable future for all of Earth’s inhabitants. The SDGs are part of the 2030 Agenda for Sustainable Development, an international plan signed by all United Nations (UN) member states in 2015 and underpinned by the foundational components of People, Planet, and Prosperity.
The 17 SDGs in the Agenda are made up of 169 objectives that include specific social, economic, and environmental targets. These targets provide a blueprint for developing a more sustainable global future.
Data acquired remotely by sensors aboard satellites and aircraft or installed on the ground play a unique role in tracking the progress toward achieving the SDGs. These remotely sensed Earth observations provide consistent and continuous information on the state of Earth processes and their change over time. These data also are integral components of socioeconomic metrics that provide a measure of how humans co-exist with the environment and the stresses they encounter through natural and human-caused changes to the environment.
NASA Earth observation data are available without restriction to all data users, a policy that is being adopted by other international space agencies and one that reduces the cost of monitoring the SDGs and provides developing countries a means to acquire and utilize these data for other policy-making purposes.
NASA’s datasets are organized by topics that help users to locate, access, and apply relevant and complementary datasets for each SDG. The Health and Air Quality Data Pathfinder addresses (but is not limited to) the following SDGs:
SDG
SDG Goals Relevant to Health and Air Quality
Image
Goal 1. End poverty in all its forms everywhere
Target 1.5: By 2030, build the resilience of the poor and those in vulnerable situations and reduce their exposure and vulnerability to climate-related extreme events and other economic, social, and environmental shocks and disasters
Image
Goal 3. Ensure healthy lives and and promote well-being for all at all ages
Target 3.9: By 2030, substantially reduce the number of deaths and illnesses from hazardous chemicals and air, water, and soil pollution and contamination
Image
Goal 7. Ensure access to affordable, reliable, sustainable and modern energy for all
Target 7a: By 2030, enhance international cooperation to facilitate access to clean energy research and technology, including renewable energy, energy efficiency, and advanced and cleaner fossil-fuel technology, and promote investment in energy infrastructure and clean energy technology
Image
Goal 11. Make cities and human settlements inclusive, safe, resilient, and sustainable
Target 11.5: By 2030, significantly reduce the number of deaths and the number of people affected and substantially decrease the direct economic losses relative to global gross domestic product caused by disasters, including water-related disasters, with a focus on protecting the poor and people in vulnerable situations
The opportunities to connect NASA data to the SDGs are infinite; therefore, the datasets included in specific Data Pathfinders are not intended to be comprehensive. Additionally, NASA datasets are not official indicators for SDG monitoring and decision-making but are complementary.
This section provides links to tools and applications relevant to analyzing and visualizing health and air quality data referenced in this Data Pathfinder. NASA's Earth Science Data Systems (ESDS) Program maintains many more resources for data analysis that may be helpful. Explore the full list on the NASA Earthdata Data Tools page.
Earthdata Search
Earthdata Search is a tool for discovering Earth science data in NASA's Earth Observing System Data and Information System (EOSDIS) collection as well as in U.S and international agencies across the Earth science disciplines. Users (including those without specific knowledge of the data) can search for and read about data collections, search for data files by date and spatial area, preview browse images, and download or submit requests for data files. An Earthdata Login is required to download data.
In the project area, you can select to customize your granule. You can reformat the data and output as HDF, NetCDF, ASCII, KML or a GeoTIFF. You can also choose from a variety of projection options. Data can be subset, enabling you to obtain only the specific attributes that are needed.
HDF and NetCDF files can be viewed using NASA's Panoply data viewer. Panoply is a cross-platform application that plots geo-referenced and other arrays. Additional functionality includes the ability to slice and plot arrays, combine arrays, and export plots and animations.
Giovanni is an online environment for the display and analysis of geophysical parameters (Note: An Earthdata Login is required for full Giovani functionality). There are a few options for analysis.
Time-averaged maps are a simple way to observe the variability of data values over a region of interest.
Map animations are a means to observe spatial patterns and detect unusual events over time.
Area-averaged time series are used to display the value of a data variable that has been averaged from all the data values acquired for a selected region for each time step.
Histogram plots are used to display the distribution of values of a data variable in a selected region and time interval.
The NASA Worldview data visualization application enables users to interactively browse more than 1,000 global, full-resolution satellite imagery layers and then download the underlying data. Many of the available imagery layers are updated within three hours of observation, which supports time-critical application areas such as wildfire management, air quality measurements, and flood monitoring. Imagery in Worldview is provided by NASA’s Global Imagery Browse Services (GIBS).
Worldview also includes imagery layers from the joint NASA/NOAA Geostationary Operational Environmental Satellite (GOES)-East and GOES-West satellites and from the Japan Meteorological Agency Himawari-8 satellite that are available at 10 minute increments for the last 30 days. These layers include Red Visible, which can be used for analyzing daytime clouds, fog, insolation, and winds; Clean Infrared, which provides cloud top temperature and information about precipitation; and Air Mass RGB, which enables the visualization of the differentiation between air mass types (e.g., dry air, moist air, etc.). These full disk hemispheric views allow for almost real-time viewing of changes occurring around most of the world.
View current natural hazards and events using the Worldview Events tab, which reveals a list of natural events, including wildfires, tropical storms, and volcanic eruptions.
Image
Worldview's Events tab provides information about events, such as tropical cyclones, wildfires, volcanic eruptions, and even large iceberg movement. Hurricane Barry, as shown in this image, traveled from the Gulf into Louisiana in July 2019. Credit: NASA Worldview.
Data animations also can be created along with comparison images for looking at different days or different datasets.
Image
Hurricane Maria was a Category 5 storm that devastated Puerto Rico in September 2017. The Woldview comparison feature enables you to compare the effect to the power grid by the storm. Left image is before the Maria hit the island; right image is from after the storm. Credit: NASA Worldview.Back to top of Tools section
Benefits and Limitations of Remote Sensing Data
The U.S. is fortunate to have numerous sources of ground-based measurements for assessing atmospheric particulate matter and other types of pollution, like ozone or NO2. However, this is not the case in other countries (or even in more remote areas of the U.S.). Satellite data provide regional to global spatial coverage, with some satellite measurements available in near real-time. Incorporating satellite and in-situ data into modeling programs makes for a more robust and integrated forecasting system. Satellite data also provide information for determining exposure and risk categories.
Image
Illustration of the vertical column of atmosphere detected by a satellite-borne sensor. Credit: NASA ARSET.
While satellite data provide a global view, it’s important to note that sensors aboard satellites measure the vertical column of air above the surface under the satellite's orbital path and not at ground level. As such, there may be some discrepancies between the column of atmosphere measured by the satellite-based sensor and ground-based observations.
In addition, polar-orbiting satellites circle Earth as the planet rotates beneath them, which means these sensors are not passing over the same spot all the time. Repeat coverage for polar-orbiting satellites can be as rapid as 1-2 days or as long as 16 days or more. Geostationary satellites, on the other hand, orbit Earth at the same velocity as the planet is rotating and constantly collect data over a fixed location. Finding the right instrument or understanding the modeling processes for your area of interest is key.