Image

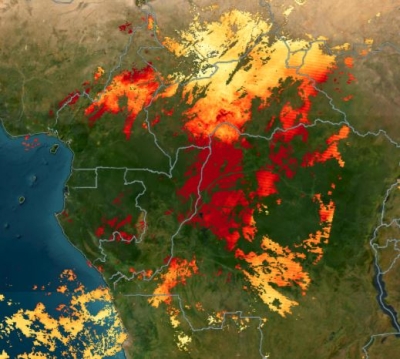
NASA's Precipitation Measurement Mission (PMM) has a global Landslide Hazard Assessment for Situational Awareness (LHASA) model, which provides information on potential landslide hazards over space and time. LHASA's landslide "nowcast" is created by comparing Global Precipitation Measurement (GPM) data from the last seven days to a historical threshold for high rainfall (95th percentile). In places where precipitation is unusually high, the susceptibility of the terrain is evaluated, which includes quantitative information on the presence or absence of roads, changes in land cover, the proximity of any major tectonic faults, the weakness of local bedrock, and the steepness of the topography. Information on this model as well as the data behind it is available at Landslides @ NASA. The data can be viewed within the Landslide Viewer and downloaded via API within the Applications Viewer.
PMM provides a continuous long-term record (over 20 years) of precipitation data through the Tropical Rainfall Measuring Mission (TRMM) and the Global Precipitation Measurement (GPM) mission. The follow-on mission, GPM, provides even more accurate measurements, improved detection of light rain and snow, and extended spatial coverage.
Image

The products from GPM are available individually and have also been integrated with data from a global constellation of satellites to yield improved spatial/temporal precipitation estimates providing a temporal resolution of 30 minutes. The Integrated Multi-satellitE Retrievals for GPM (IMERG) contains multiple runs, which accommodate different user requirements for latency and accuracy (Early = 4 hours, e.g., for flooding events; Late = 12 hours, e.g., for crop forecasting; and Final = 3 months, with the incorporation of rain gauge data, for research).
Research-quality data products can be accessed via Earthdata Search:
- IMERG from Earthdata Search
Early, Late, and Final precipitation data on the half hour or 1-day timeframe. Data are in NetCDF or HDF format, and can be opened using Panoply. Data are available from 2000.
GIS analysis-ready datasets in GeoTIFF format can be accessed from the Precipitation Processing System site. Note that you will need to register to access the FTP site.
Data products can be visualized as a time-averaged map, an animation, seasonal maps, scatter plots, or a time series through an online interactive tool, Giovanni. Follow these steps to plot data in Giovanni: 1) Select a map plot type. 2) Select a date range. Data are in multiple temporal resolutions, so be sure to note the start and end date to ensure you access the desired dataset. 3) Check the box of the variable in the left column that you would like to include and then plot the data. For more information on choosing a type of plot, see the Giovanni User Manual.
- IMERG in Giovanni: Data are available from 2000–present.
Data can be visualized in Worldview:
- IMERG Precipitation Rate in Worldview
- AMSR2 Precipitation Rate in Worldview
Advanced Microwave Scanning Radiometer 2 (AMSR2) instrument collects data that indicate the rate at which precipitation is falling on the surface of the ocean and is measured in millimeters per hour (mm/h). - NLDAS Precipitation Total in Worldview
- GLDAS Precipitation Total in Worldview (only goes through 2010)
The NLDAS monthly Precipitation Total data are generated through temporal accumulation of the hourly data, and the GLDAS monthly data are generated through temporal averaging of the 3-hourly data. The data are in unit "kg/m2/s" which is equivalent to "mm/s." - IMERG Early Run Half-Hourly at PMM
The NRT "early run" product at PMM is generated every half hour with a 6-hour latency from the time of data acquisition.
Daymet is a collection of gridded estimates of daily weather parameters. It is modeled on daily meteorological observations. Weather parameters in Daymet include daily minimum and maximum temperature, precipitation, vapor pressure, radiation, snow water equivalent, and day length at 1 km resolution over North America, Puerto Rico, and Hawaii.
Daymet data can be retrieved in a variety of ways, including Earthdata Search, an Oak Ridge National Laboratory Distributed Active Archive Center (ORNL DAAC) API, tools developed by ORNL DAAC, or through NASA's Land Processes DAAC (LP DAAC) Application for Extracting and Exploring Analysis Ready Samples (AppEEARS).
Model Data
NEX-GDDP-CMIP6
The NASA Earth Exchange Global Daily Downscaled Projections (NEX-GDDP) dataset is comprised of high-resolution, bias-corrected global downscaled climate projections derived from the General Circulation Model (GCM) runs conducted under the Coupled Model Intercomparison Project Phase 6 (CMIP6) and across all four “Tier 1” greenhouse gas emissions scenarios known as Shared Socioeconomic Pathways (SSPs).
This dataset provides a set of global, high resolution, bias-corrected climate change projections that can be used to evaluate climate change impacts on processes that are sensitive to finer-scale climate gradients and the effects of local topography on climate conditions. Uses include: air temperature, precipitation volume, humidity, stellar radiation, and atmospheric wind speed.
NEX-GDDP-CMIP6 data are available through the NASA Center for Climate Simulation (NCCS):
Rainfall decreases the soil's shear strength by accumulating in the subsurface as soil moisture. Soil moisture is, therefore, important to understand if oversaturated conditions exist, when a rainfall event occurs. If so, this could contribute to excess runoff and landslide potential.
Current ground measurements of soil moisture are sparse and have limited coverage; satellite data help fill in those gaps. On the other hand, satellite data are limited by their relatively coarse resolution; the preferred measurement should be chosen based upon your needs. Utilizing a combination of both ground-based and remote sensing data provides for spatial and temporal data continuity.
Image

NASA's Soil Moisture Active Passive (SMAP) satellite measures the moisture in the top five cm of soil globally, every 2–3 days, at a resolution of 9–36 km. NASA, in collaboration with other agencies, has also developed models of soil moisture content, incorporating satellite information with ground-based data when available. These models are part of the Land Data Assimilation System (LDAS), of which there is a global collection (GLDAS) and a North American collection (NLDAS). LDAS takes inputs of measurements like precipitation, soil texture, topography, and leaf area index and then uses those inputs to model output estimates of soil moisture and evapotranspiration.
Research-quality data products can be accessed via Earthdata Search; datasets are available in HDF5 format, which are also customizable to GeoTIFF.
ORNL DAAC's Soil Moisture Visualizer integrates ground-based, SMAP, and other soil moisture data into a visualization and data distribution tool. LP DAAC's AppEEARS offers another option to simply and efficiently extract subsets, transform, and visualize SMAP data products. See Tools for Data Access and Visualization for additional information.
Data products can be visualized as a time-averaged map, an animation, seasonal maps, scatter plots, or a time series through an online interactive tool, Giovanni. Follow these steps to plot data in Giovanni: 1) Select a map plot type. 2) Select a date range. Data are in multiple temporal resolutions and multiple temporal coverages, so be sure to note the start and end date to ensure you access the desired dataset. 3) Check the box of the variable in the left column that you would like to include and then plot the data. For more information on choosing a type of plot, see the Giovanni User Manual.
Data can be visualized in Worldview:
Image
 mission.")
As sediments go through the weathering process of freezing and thawing, the cohesion between the rock grains is reduced. This destabilizes the overall structure of the material, contributing to landslides. The SMAP mission has a Level 3 product that quantifies the nature, extent, timing, and duration of landscape seasonal freeze/thaw transitions, which can help in the assessment of landslide potential.
Research-quality data products, can be accessed via Earthdata Search:
- SMAP Freeze/Thaw in Earthdata Search
Datasets are also customizable to GeoTIFF format.
Data can be visualized in Worldview:
Image

Knowing local topography is essential for disaster managers and emergency management professionals seeking to assess an area's risk level, including landslide potential and runoff.
A method for delineating topography is NASA's Shuttle Radar Topography Mission (SRTM). SRTM provides a digital elevation model of all land between 60 degrees north and 56 degrees south, about 80% of Earth's landmass. The spatial resolution is 30 m in the horizontal plane. The Advanced Spaceborne Thermal Emission and Reflection Radiometer (ASTER) Global Digital Elevation Model (GDEM) coverage spans from 83 degrees north latitude to 83 degrees south, encompassing 99% of Earth's landmass. The spatial resolution is 30 m in the horizontal plane.
On average, compared to geodetic points over the U.S., SRTM data has a lower root mean square error (RMSE); RMSE is a commonly used method to express vertical accuracy of elevation datasets. Digital elevation model data accuracy is typically very sensitive to vegetation cover, however. ASTER tends to perform better over certain landcover types.
February 2020, LP DAAC released a new data product, NASADEM, available at 1 arc-second resolution. NASADEM extends the legacy of the SRTM by improving the DEM height accuracy and data coverage as well as providing additional SRTM radar-related data products. The improvements were achieved by reprocessing the original SRTM radar signal data and telemetry data with updated algorithms and auxiliary data not available at the time of the original SRTM processing.
- AppEEARS offers a simple and efficient way to access SRTM, NASADEM, and ASTER data.
- SRTM from Earthdata Search
These data were acquired in 2000 and are in HGT format, which can be opened in most GIS programs, such as ArcGIS or QGIS. Data are also customizable to GeoTIFF. - ASTER GDEM from Earthdata Search
Version 3, released August 2019, has a decrease in elevation void area due to the increase of ASTER stereo image data and an improved process as well as a decrease in water area anomaly data (due to using new global water body data). For more information on the new release, read this LP DAAC news release. - NASADEM from Earthdata Search
- SRTM and ASTER DEMs in Worldview
Remote sensing information provides critical insight to identify landslide activity, characterize the triggering patterns of these events spatially and temporally, assess the surface conditions for potential activity, and support the full cycle of disaster risk assessment. NASA Disasters creates products for specific events and provides other information to help interpret the data. In addition, you can interactively explore GIS-friendly data within NASA's ArcGIS Online (AGOL).
NRT Landslides Products from NASA's Disasters program:
Event Response Story Maps:
Image
 on Landsat 8 acquired the above image of landslide debris from the Oso, Washington landslide and the barrier lake that formed subsequently on March 23, 2014.")
Once a landslide event has occurred, there are various types of remote sensing data that can be used to measure displacement in an area. A landslide event can be a single landslide or can be numerous (several tens to thousands), caused by a major triggering event, like a tropical storm.
The NASA Landslide Viewer is a GIS-based web portal that provides global landslide data from NASA, citizen scientists, and other resources. Landslides @ NASA has additional information on using the viewer, data citations, and other resources. The viewer provides information on global landslide susceptibility, which combines information on elevation, geology, fault, roads, and forest loss to rank most of the Earth's land surface.
Land surface reflectance can be used to monitor and measure the displacement of sedimentary material once a flow or fall has occurred. This is important in assessing damage to the surrounding area, as well as for future hazard mapping.
Instruments that are primarily used for this measurement include the Moderate Resolution Imaging Spectroradiometer (MODIS) aboard NASA's Aqua and Terra satellites, and the Visible Infrared Imaging Radiometer Suite (VIIRS) aboard the joint NASA/NOAA Suomi National Polar-orbiting Partnership (Suomi NPP) and NOAA-20 Joint Polar Satellite System 1 (JPSS-1) satellites. MODIS reflectance products are available at 250 m, 500 m, 1000 m, and 5600 m spatial resolution. VIIRS reflectance products are available at 500 m and 1000 m spatial resolution. MODIS data are acquired every one to two days, whereas the wider swath width of VIIRS allows for daily global coverage.
The Advanced Spaceborne Thermal Emission and Reflection Radiometer (ASTER) acquires visible and near-infrared (VNIR) reflectance data at 15 m resolution and SWIR (through 2009) reflectance data at 30 m resolution. Note that ASTER is a tasked sensor, meaning that it only acquires data when it is directed to do so over specific targets, making its temporal resolution variable depending on your target region of interest. ASTER Surface Reflectance products are processed on-demand and so must be requested with additional parameters. Note that there is a limit to 2000 granules per order.
Research-quality surface reflectance data products can be accessed directly via Earthdata Search or LP DAAC's Data Pool; MODIS, VIIRS, and ASTER are available in HDF format, but are also customizable to GeoTIFF:
- MODIS Surface Reflectance from Earthdata Search
- Suomi NPP VIIRS Surface Reflectance from Earthdata Search
- ASTER Surface Reflectance from Earthdata Search
LP DAAC's AppEEARS offers a simple and efficient way to access, transform, and visualize geospatial data from a variety of federal data archives. MODIS and VIIRS surface reflectance data are available in AppEEARS, as well as the USGS Landsat Analysis Ready Data (ARD) surface reflectance product.
ORNL DAAC also provides tools for on-demand subsetting of MODIS and VIIRS land data. In particular, the Subsets API allows users to retrieve custom subsets, analytics and visualization of MODIS and VIIRS data products.
For higher resolution, the Landsat 7 Enhanced Thematic Mapper (ETM+) sensor and the Landsat 8 Operational Land Imager (OLI) instrument acquire data at 30 m spatial resolution in VNIR every 16 days (or less as you move away from the equator). Landsat 8 was developed as a collaboration between NASA and the USGS. The USGS leads satellite operations and data archiving at the Earth Resources Observation and Science center.
Landsat data can be discovered using Earthdata Search, however, you will need a USGS Earth Explorer login to download the data.
- Landsat 8 Operational Land Imager from Earthdata Search
- Landsat 7 Enhanced Thematic Mapper Plus from Earthdata Search
Another high resolution option is the new (but currently provisional) Harmonized Landsat and Sentinel-2 (HLS) project, which provides consistent surface reflectance and top of atmosphere brightness data from the OLI aboard the joint NASA/USGS Landsat 8 satellite and the Multi-Spectral Instrument (MSI) aboard the European Space Agency's (ESA) Copernicus Sentinel-2A and -2B satellites. The combined measurement enables global observations of the land every 2–3 days at 30 m spatial resolution.
Data can be visualized in Worldview:
- MODIS True Color in Worldview
Note that Worldview does have a corrected reflectance product but it is not a standard, research-quality product. The purpose of this algorithm is to provide natural-looking images by removing gross atmospheric effects, such as Rayleigh scattering, from MODIS visible bands 1-7. - Suomi NPP VIIRS Surface Reflectance in Worldview
Note that the VIIRS Corrected Reflectance imagery is available only as near real-time imagery. - NOAA-20 VIIRS Surface Reflectance in Worldview
- HLS Surface Reflectance in Worldview
Image

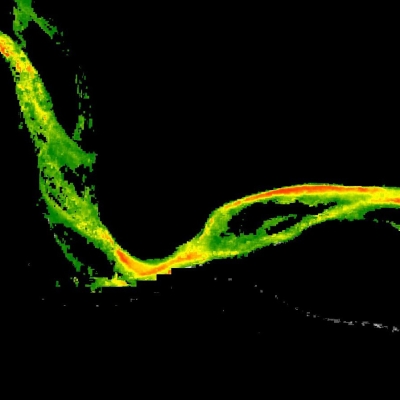
Vegetation indices measure the amount of green vegetation over a given area and can be used to assess vegetation health. A commonly-used vegetation index is the Normalized Difference Vegetation Index (NDVI), which uses the difference between near-infrared (NIR) and red reflectance divided by their sum. NDVI values range from -1 to 1. Low values of NDVI generally correspond to barren areas of rock, sand, exposed soils, or snow, while higher NDVI values indicate greener vegetation, including forests, croplands, and wetlands. The enhanced vegetation index (EVI) is another widely used vegetation index that minimizes canopy-soil variations and improves sensitivity over dense vegetation conditions.
Vegetation products from the MODIS instrument (on the Aqua and Terra satellites) and the Suomi NPP VIIRS instrument can be accessed in various ways.
Research-quality data products can be accessed directly via Earthdata Search; datasets are available in HDF format but are, in some cases, customizable to GeoTIFF.
- Terra MODIS Vegetation Indices from Earthdata Search
- Aqua MODIS Vegetation Indices from Earthdata Search
- VIIRS Vegetation Indices from Earthdata Search
LP DAAC's AppEEARS offers a simple and effective way to extract, transform, visualize, and download MODIS and VIIRS vegetation-related data products. AppEEARS allows users to subset data by defining specific point(s) or area(s) of interest, and output data can be downloaded in csv (point), GeoTIFF (area) or NetCDF4 (area) format. Explore LP DAAC's Getting Started with Cloud-Native Harmonized Landsat Sentinel (HLS) Data in Python Jupyter Notebook for extracting an EVI Time Series from HLS.
ORNL DAAC's subsetting tools provide a means to simply and efficiently access and visualize MODIS and VIIRS vegetation-related data products as well.
Data products can be visualized as a time-averaged map, an animation, seasonal maps, scatter plots, or a time series through an online interactive tool, Giovanni. Follow these steps to plot data in Giovanni: 1) Select a map plot type. 2) Select a date range. Data are in multiple temporal coverages, so be sure to note the start and end date to ensure you access the desired dataset. 3) Check the box of the variable in the left column that you would like to include and then plot the data. For more information on choosing a type of plot, see the Giovanni User Manual.
- MODIS NDVI in Giovanni
Data can be downloaded in GeoTIFF format.
Data can be visualized in Worldview:
- MODIS NDVI in Worldview
This dataset has a spatial resolution of 250 m and a temporal resolution of eight days. 16-day and monthly data are also available within Worldview. - MODIS EVI in Worldview
This dataset is monthly at 1 km spatial resolution. Rolling 8-day and 16-day data are also available within Worldview.
MODIS NDVI is also available through geospatial web map services. For information on accessing the data within a GIS program, view the Biosphere Geospatial Services within the GIS Data Pathfinder.
Image

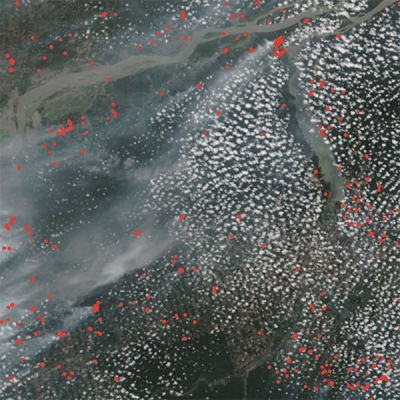
The VIIRS Day/Night Band (DNB) shows the earth’s surface and atmosphere using a sensor designed to capture low-light emission sources, under varying illumination conditions, which provides an assessment of power outages across an area due to the storm event.
Note that the imagery to the right is not showing raw imagery of light. A team of scientists from NASA’s Goddard Space Flight Center and Marshall Space Flight Center processed and corrected the raw data to filter out stray light from the Moon, fires, airglow, and any other sources that are not electric lights. Their processing techniques also remove as much other atmospheric interference as possible.
NASA has also developed the Black Marble, a daily calibrated, corrected, and validated product suite, so nightlight data can be used effectively for scientific observations. Black Marble's standard science processing removes cloud-contaminated pixels and corrects for atmospheric, terrain, vegetation, snow, lunar, and stray light effects on the VIIRS DNB radiances. Black Marble data can be accessed at NASA's Level-1 and Atmosphere Archive and Distribution System DAAC (LAADS DAAC). Black Marble imagery in Worldview is an image composite that was assembled from clear, cloud free images for 2012 and 2016. Black Marble also provides a Nighttime Blue/Yellow Composite which is a false color composite created using the VIIRS at-sensor radiance and brightness temperatures from the M15 band.
- Black Marble at LAADS DAAC
- Black Marble Imagery in Worldview
- Black Marble Blue/Yellow Composite imagery in Worldview
For more information on the VIIRS DNB and Black Marble products, read the Nighttime Lights Backgrounder.
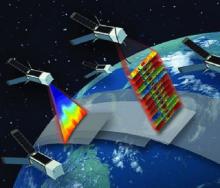
Repeat-pass radar interferometry from spaceborne platforms is routinely used to produce topographic change maps as digital displacement models. When two observations are made from the same location in space but at different times, the interferometric phase is directly proportional to any change in the range of a surface feature. This change allows for the measurement of any displacement or ground deformation that has occurred between the time of the two observations.
Image
, NASA’s airborne prototype for the NASA-Indian Space Research Organisation SAR (NISAR) mission. In this type of map, called an interferogram, the colors show contours of ground movement.")
Interferometric SAR (InSAR) thus provides centimeter-level measurements of displacement from landslides. This displacement or deformation is seen as contour lines; where the lines are closer together, there was a lot of movement. Discontinuities in the contour lines also show where the actual fault rupture is. Contour lines are half of the radar's wavelength; so Sentinel-1 with a radar length of 6 cm has contour lines indicating ground deformation of 3 cm.
Research-quality data products can be accessed via Earthdata Search or from NASA's Alaska Satellite Facility DAAC (ASF DAAC).
- Sentinel-1A and Sentinel-1B SAR data from Earthdata Search
When choosing SAR data for interferometry, inclusion of phase information is required. Level 1 data are produced as single look complex (SLC), in which the phase information is preserved. To learn more about SAR processing Level 1 data, view the ASF DAAC SAR data recipes (select InSAR). - Sentinel-1A and Sentinel-1B SAR data from Vertex
Vertex is ASF DAAC's search tool, which allows for the preview of numerous types of SAR data, including Sentinel-1. - UAVSAR from Earthdata Search
Uninhabited Aerial Vehicle SAR (UAVSAR) is an airborne SAR instrument operating at L-band. Missions over portions of North America, Greenland, Iceland, and North, Central, and South America were conducted from 2008 to present. - UAVSAR from Vertex
- ALOS PALSAR from Earthdata Search
From 2006-2011, the Phased Array type L-band SAR (PALSAR), aboard the Advanced Land Observing Satellite-1 (ALOS-1) acquired data from multiple observation modes with varying polarizations and resolutions. - ALOS PALSAR from Vertex
Radiometrically terrain corrected (RTC) data are available in GeoTIFF format.
To learn more about SAR, view What is SAR? or Getting Started with SAR; For information on processing Level 1 data, view the Introduction to SAR training from NASA's Applied Remote Sensing Training (ARSET).
SARVIEWS Hazard Portal is a SAR-based hazard monitoring service funded by NASA's Applied Sciences program and based at ASF DAAC. It is a fully automatic processing system that produces value-added products in support of monitoring natural disasters. The SARVIEWS processor is implemented in the Amazon Cloud and utilizes modern processing technology to generate geocoded and fully terrain-corrected image time series, as well as InSAR data over areas affected by natural disasters.