Research exploring the dark mix of minerals, organic materials, and other elements we call soil is important to everyone everywhere. Soils provide a substrate for plants to grow, filter water, provide habitat for ecosystems, and protects terrain from erosion to name a few of its essential functions. Scientists study Earth's soils with NASA data ranging from soil moisture measurements to maps of above and belowground biomass carbon. The data come from technology such as the Global Navigation Satellite System (GNSS) and Moderate Resolution Imaging Spectroradiometer (MODIS) instrument. The data are used around the world to inform crop production, study ecosystem health, monitor drought and wildfire potential, calculate stored carbon and other chemical ground sequestration, predict weather, and many other important purposes.

Dig into NASA's soils data to see how much they can help you learn more about this medium that is a foundational component for supporting life on Earth.

Get Soils Data

Access a range of datasets and data tools to further your soils research.

Learn How to Use Soils Data

Access a range of webinars, tutorials, data recipes, and data stories to enhance your knowledge of Earth Observation data.
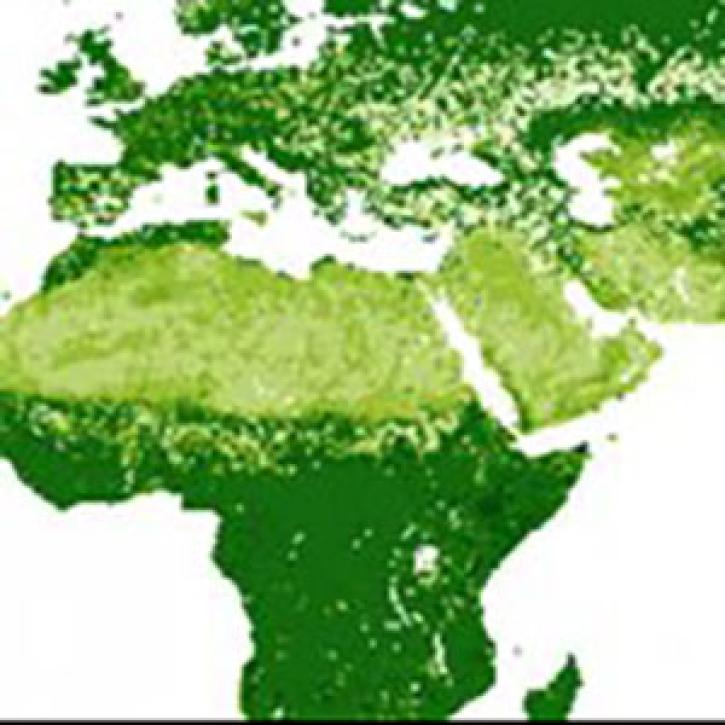
Image of forest biomass
Mapping Carbon Beyond Forests: New Harmonized Global Maps of Above and Belowground Biomass Carbon
New maps combine remotely sensed biomass data for different land cover types into harmonized global maps of above and belowground biomass.
This stovepipe tornado formed on May 31, 2010, near the border between Colorado and Oklahoma.
The Dirt on Tornadoes
Moisture on the ground may fuel more violence in the sky.
Earthdata graphic identifier on top of satellite image of Earth
Efficient Geospatial Data Access With NASA's AppEEARS
Learn more about NASA's Application for Extracting and Exploring Analysis Ready Samples (AppEEARS). This webinar showcases the system's capabilities and highlights learning resources to help simplify data access workflows using AppEEARS.
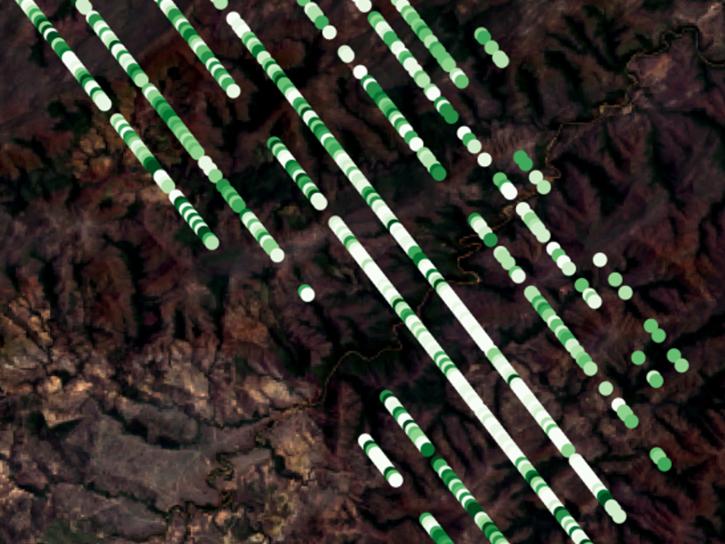
GEDI Level 2B Plant Area Index southwest of Chapada dos Veadeiros National Park, Brazil, on October 29, 2020
Mapping Wildfires, Volcanic Ash, and Soil Respiration
Read highlights of three publications that detail how NASA Earth observation data are used to map wildfire fuel loads, analyze volcanic ash composition, and improve soil respiration models in agricultural systems.
Discover and Visualize Soils Data
NASA data help us understand Earth's changing systems in more detail than ever before, and visualizations bring these data to life, making Earth science concepts accessible, beautiful, and impactful.
Data visualization is a powerful tool for analysis, trend and pattern recognition, and communication. Our resources help you find world-class data visualizations to complement and enhance your research. We also have tools and tutorials to help you translate soils data into compelling visuals.
Image
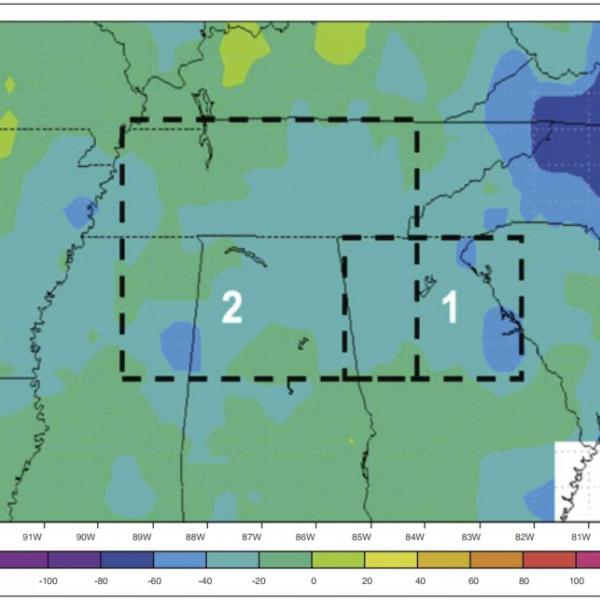
TRMM data
This visualization depicts rainfall patterns from February 2006 through February 2008 using data from the Tropical Rainfall Measuring Mission (TRMM). The blue and green colors over the study area indicate the region was undergoing a strong drought. Dotted black lines indicate the study area; the researchers first focused on northern Georgia (box 1), and then expanded to investigate a larger portion of the southeastern United States (box 2). Credit: Environmental Research Letters and M. Shepherd

Join Our Community of NASA Data Users

While NASA data are openly available without restriction, an Earthdata Login is required to download data and to use some tools with full functionality.

Learn About the Benefits of Earthdata Login

Frequently Asked Questions

Earthdata Forum

Our online forum provides a space for users to browse thousands of FAQs about research needs, data, and data applications. You can also submit new questions for our experts to answer.

Submit Questions to Earthdata Forumand View Expert Responses
Earthdata
Forum