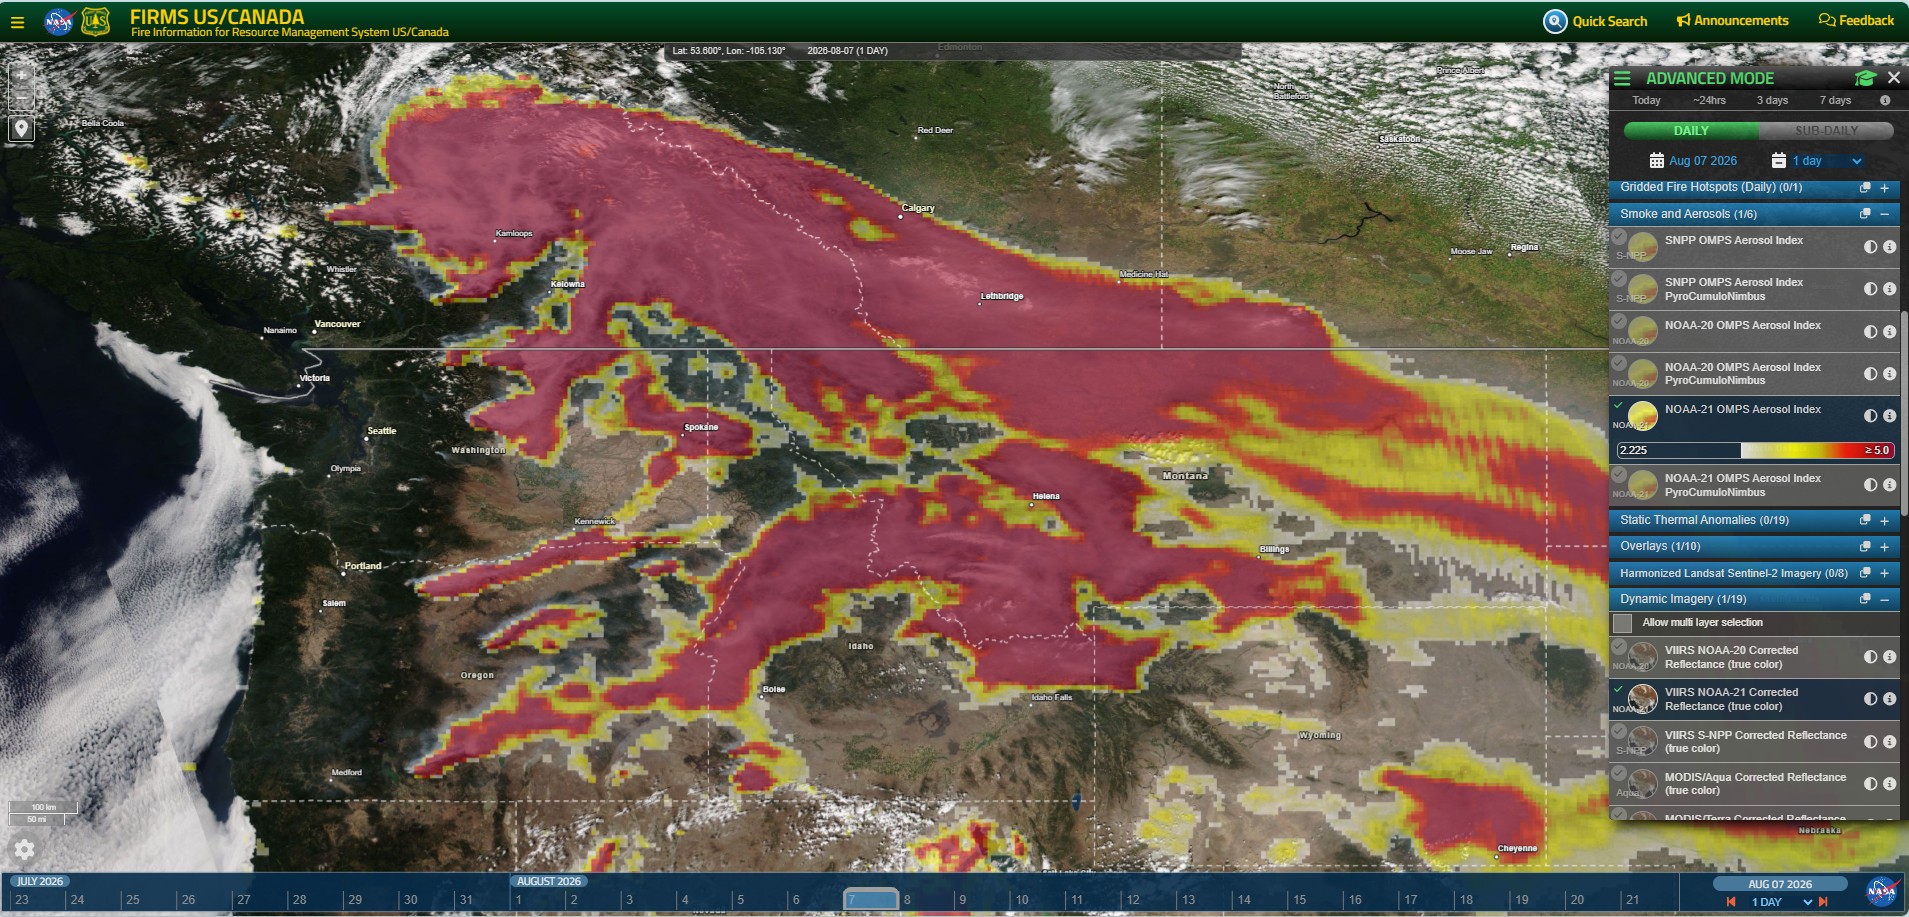
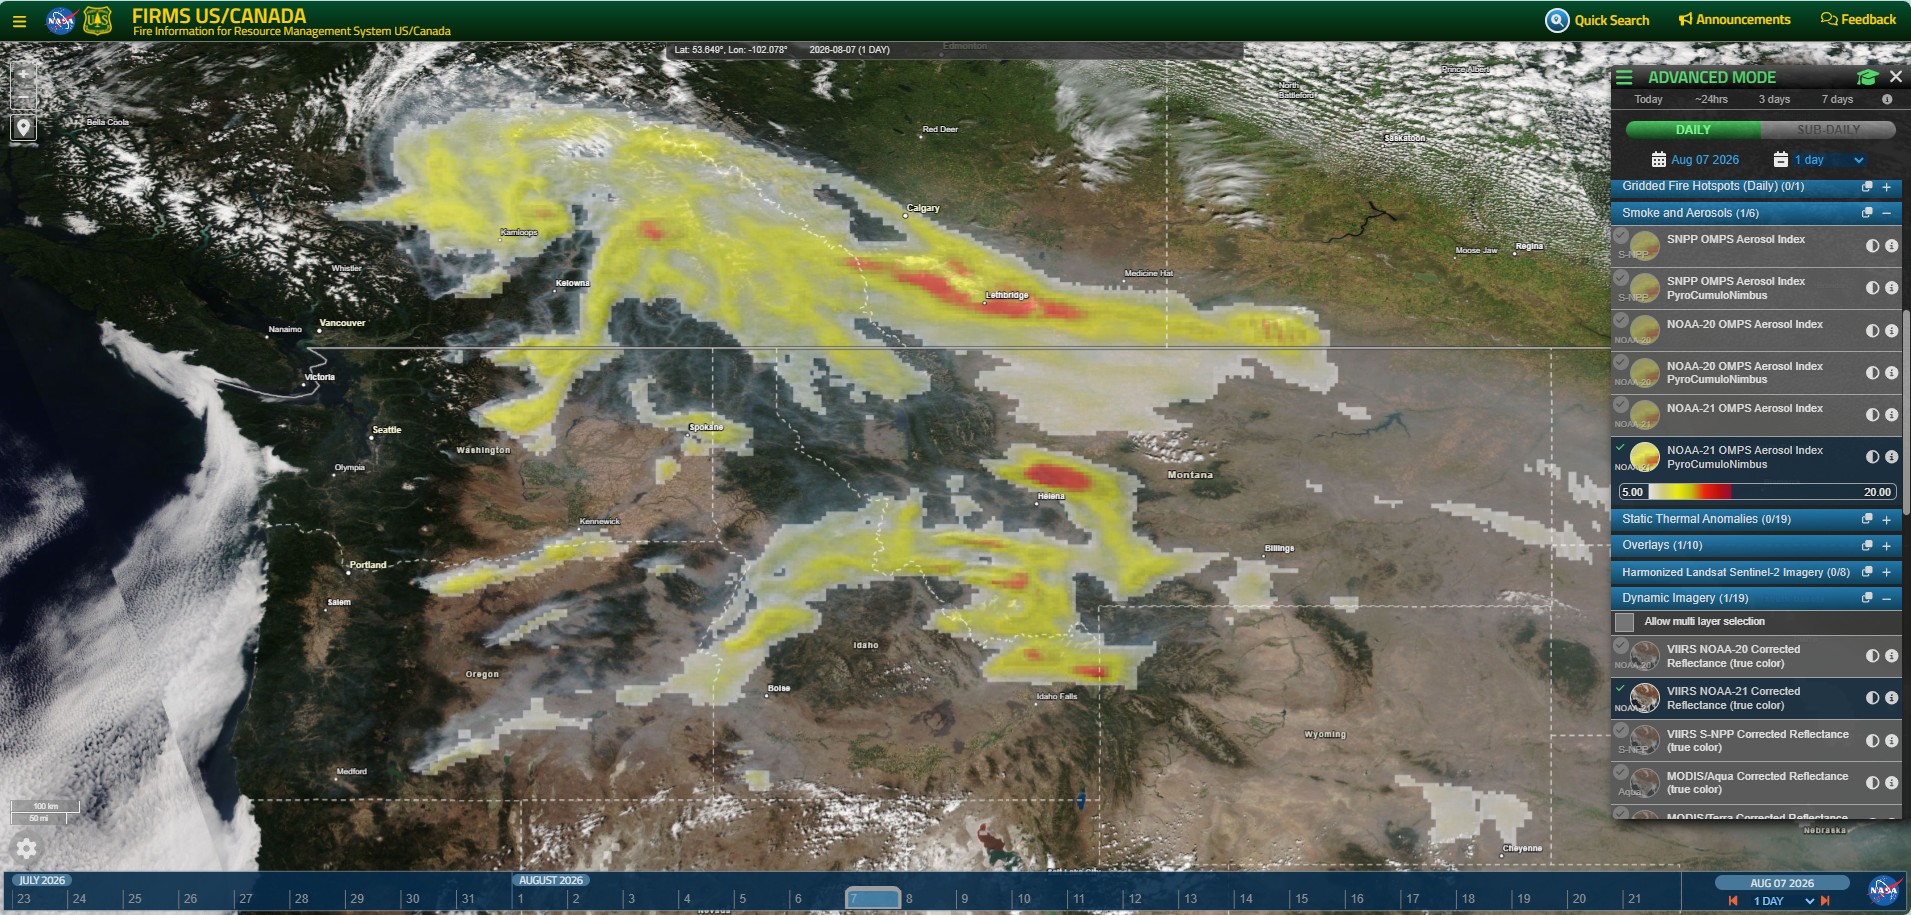
NASA FIRMS recently introduced the NOAA-21 Ozone Mapping and Profiler Suite (OMPS) Aerosol Index (AI) and PyroCumuloNimbus Aerosol Index layers into the map viewers for Fire Information for Resource Management System (FIRMS) Global and FIRMS US/Canada. Updated daily, these products are critical tools for detecting the presence of smoke, dust, and volcanic ash in the atmosphere. Data is available back to April 28, 2025.
Sharper Insights with Higher Spatial Resolution
The new NOAA-21 OMPS products complement existing NOAA-20 and Suomi NPP indices currently available in FIRMS, but offer a significant upgrade in spatial resolution, giving users a much clearer picture of aerosol dispersion:
- NOAA-21 OMPS AI products (New): 12 km x 10 km (∼6 x 6 miles)
- NOAA-20 OMPS AI products: 17 km x 12 km (∼10.5 x 7.5 miles)
- Suomi NPP OMPS AI products: 50 km x 50 km (∼31 x 31 miles)
Choosing the Right Layer for Your Needs
- Regular Aerosol Index (Range 0.0 to 5.0): Ideal for everyday monitoring. Higher values in this range highlight aerosols that may reduce visibility or impact human health at the surface level.
- PyroCumuloNimbus Aerosol Index (Range 0.0 to 50.0): Designed for assessing extreme events, such as heavy wildfire smoke or volcanic eruptions. Values greater than 10 typically indicate that aerosols have been injected high into the upper troposphere (16,000 to 40,000 feet) or lower stratosphere (>40,000 feet).
💡 FIRMS Pro Tip: While in the map viewer, simply move your cursor over the displayed aerosol layer to view the exact measured index value in the legend on the right-hand side of your screen.
See It in Action
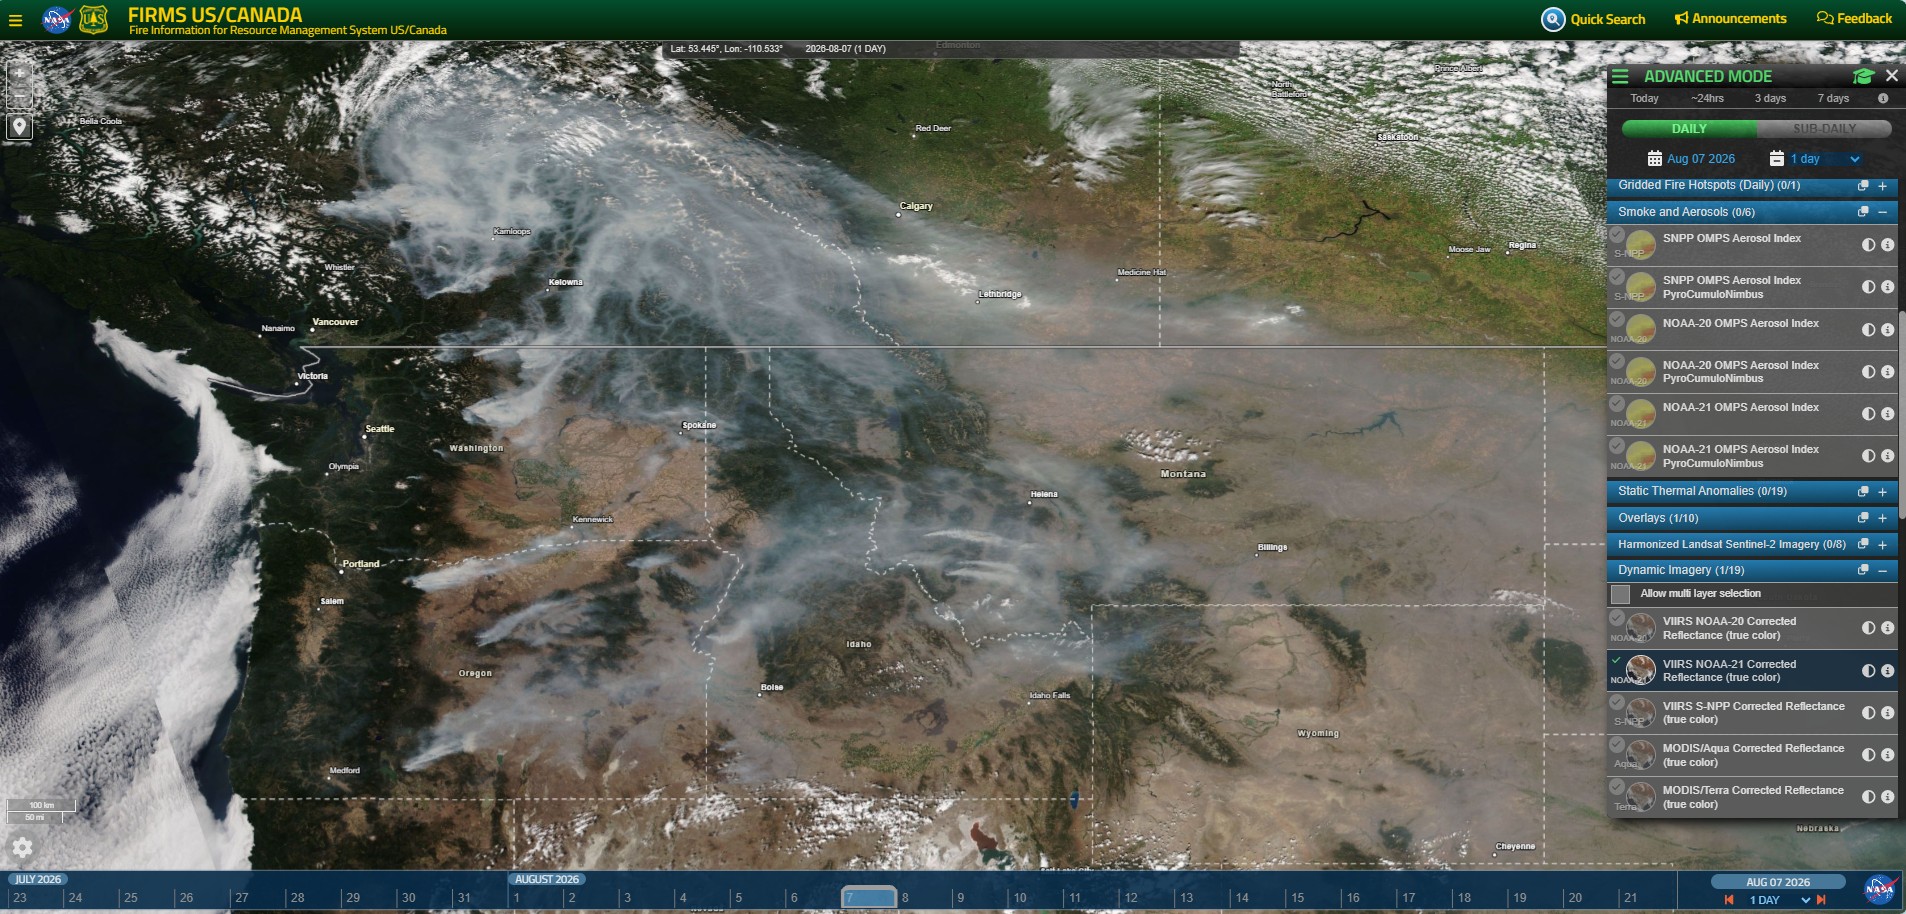
The graphics below compare the NOAA-21 OMPS regular Aerosol Index and the PyroCumuloNimbus Aerosol Index while tracking thick smoke from fires in the northwestern United States and southwestern Canada on August 7, 2026. View these data in FIRMS.