Access a range of datasets and data tools to further your cloud properties research.
Terra Satellite Observations to Cease on December 1, 2026
Read the data alert
Clouds are accumulations of water droplets and ice crystals in the atmosphere. They are shaped by complex atmospheric and climatic conditions, form more than a dozen distinct types, and provide both opportunities and challenges for studying Earth from space. While heavy cloud cover can hide surface conditions from certain Earth-observing instruments, measuring the specific properties of clouds — such as particle size, water content, and cloud pressure — can provide valuable insight into Earth’s energy cycles, weather systems, and temperature regulation.
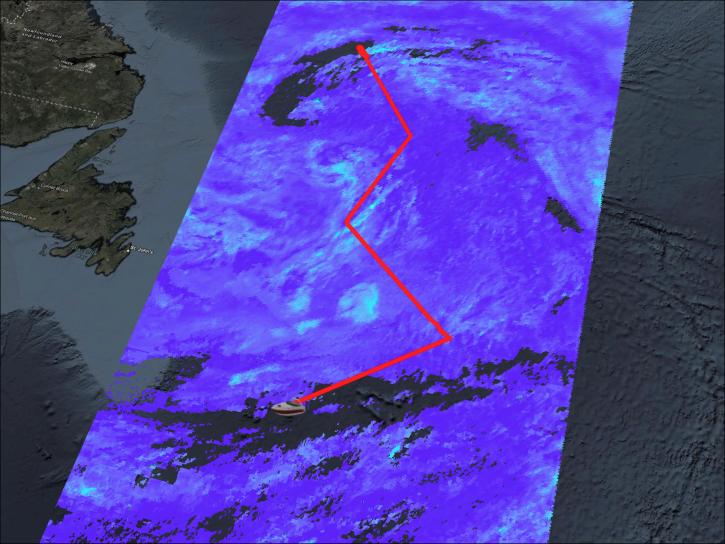
NASA studies the properties of clouds by measuring how they absorb and scatter different wavelengths of light. Instruments like the Ocean Color Instrument and Hyper Angular Rainbow Polarimeter 2 (OCI and HARP2) on the Plankton, Aerosol, Cloud, ocean Ecosystem (PACE) satellite, and the Atmospheric Infrared Sounder (AIRS) on the Aqua satellite use the difference in reflection of wavelengths to identify the balance of water and ice molecules in clouds. This is known as particle phase, and it helps scientists model and monitor the role of these clouds in precipitation and temperature regulation.
Other scientifically useful properties of clouds include:
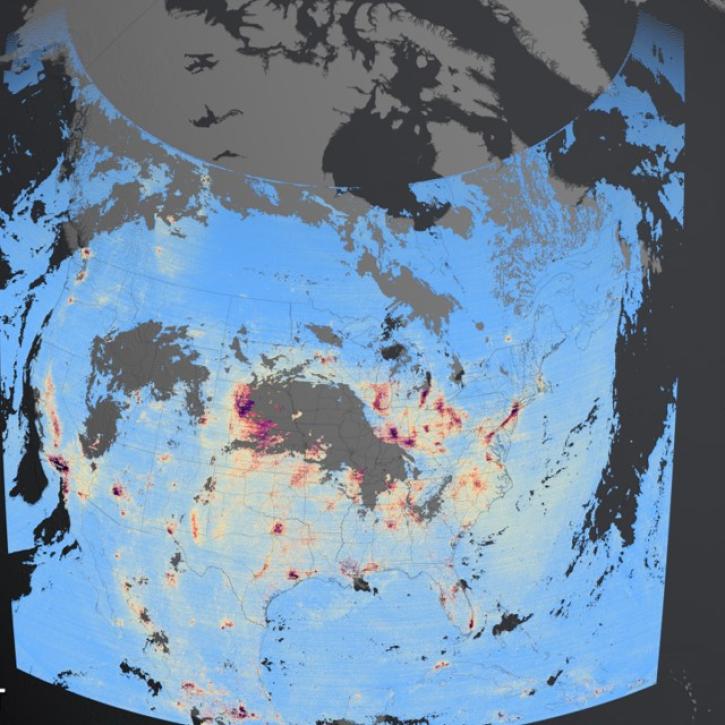
NASA-funded instruments like the Ozone Monitoring Instrument (OMI) and Tropospheric Emissions: Monitoring of Pollution (TEMPO) measure these variables. The Clouds and the Earth’s Radiant Energy System (CERES) instruments, carried by several satellites such as the Tropical Rainfall Monitoring Mission (TRMM), Terra, and Aqua, monitor global cloud properties. The integrated CERES datasets on NASA Earthdata combine observations from these instruments into an integrated global cloud dataset.
Cloud observations can be used to identify large-scale weather and wind patterns, and can provide early signs of developing storms. Several specific cloud properties are also used in climate and weather models. Cloud particle phase, temperature, and altitude can be used in simulations that can assess drought risk, predict the formation of hurricanes, and project global cycles of heating and cooling. Global cloud observations thus play a vital role in climate science, meteorology, and understanding the cycles that shape life on Earth.
Access a range of datasets and data tools to further your cloud properties research.

While NASA data are openly available without restriction, an Earthdata Login is required to download data and to use some tools with full functionality.
Learn About the Benefits of Earthdata LoginQUESTIONS & SUPPORT
Get help with NASA Earth science data, datasets, tools, services, and metadata on the Earthdata Forum. Experienced staff in the data user community review and answer questions.
Get help on Earthdata Forum