We are in the process of migrating all NASA Earth science data sites into Earthdata from now until end of 2026. Not all NASA Earth science data and resources will appear here until then. Thank you for your patience as we make this transition.
Read about the Web Unification Project
Precipitation Data Access and Tools
NASA has a wide range of precipitation data, from hourly rainfall estimates to reanalysis datasets looking back decades. Our datasets and tools help users spot characteristics, trends, patterns, and anomalies in the precipitation that falls to Earth and understand how it affects natural areas and human communities.
Precipitation Datasets
| Dataset Sort descending | Version | Platform | Instrument | Temporal Extent | Spatial Extent | Spatial Resolution | Data Format |
|---|---|---|---|---|---|---|---|
| TRMM (TMPA) Rainfall Estimate L3 3 hour 0.25 degree x 0.25 degree V7 (TRMM_3B42) at GES DISC | 7 | TMPA | NOT APPLICABLE | 1997-12-31 to 2019-12-31 |
N: 50 S: -50 E: 180 W: -180 |
0.25 Decimal Degrees x 0.25 Decimal Degrees | |
| TRMM (TMPA/3B43) Rainfall Estimate L3 1 month 0.25 degree x 0.25 degree V7 (TRMM_3B43) at GES DISC | 7 | TMPA | NOT APPLICABLE | 1998-01-01 to 2019-12-31 |
N: 50 S: -50 E: 180 W: -180 |
0.25 Decimal Degrees x 0.25 Decimal Degrees | |
| TRMM (TMPA-RT) Near Real-Time IR precipitation estimate L3 1-hour 0.25 degree x 0.25 degree V7 (TRMM_3B41RT) at GES DISC | 7 | TMPA | NOT APPLICABLE | 2000-02-29 to 2019-12-31 |
N: 60 S: -60 E: 180 W: -180 |
0.25 Decimal Degrees x 0.25 Decimal Degrees | |
| TRMM (TMPA-RT) Near Real-Time Microwave precipitation estimate L3 3 hour 0.25 degree x 0.25 degree V7 (TRMM_3B40RT) at GES DISC | 7 | TMPA | NOT APPLICABLE | 2000-02-29 to 2019-12-31 |
N: 60 S: -60 E: 180 W: -180 |
0.25 Decimal Degrees x 0.25 Decimal Degrees | |
| TRMM (TMPA-RT) Near Real-Time Precipitation L3 1 day 0.25 degree x 0.25 degree V7 (TRMM_3B42RT_Daily) at GES DISC | 7 | TMPA | NOT APPLICABLE | 2000-03-01 to 2020-01-01 |
N: 60 S: -60 E: 180 W: -180 |
0.25 Decimal Degrees x 0.25 Decimal Degrees | |
| TRMM (TMPA-RT) Near Real-Time Precipitation L3 3 hour 0.25 degree x 0.25 degree V7 (TRMM_3B42RT) at GES DISC | 7 | TMPA | NOT APPLICABLE | 2000-02-29 to 2020-01-01 |
N: 60 S: -60 E: 180 W: -180 |
0.25 Decimal Degrees x 0.25 Decimal Degrees | |
| TRMM TROPICAL CYCLONE PRECIPITATION FEATURE (TCPF) DATABASE - LEVEL 1 V1 | 1 | TRMM | LIS, PR, TMI, VIRS | 1997-12-08 to 2011-12-30 |
N: 39.11 S: -39.14 E: 180 W: -179.98 |
HDF4 | |
| Tropical Cyclone Intensity (TCI) Hurricane Imaging Radiometer (HIRAD) V2.1 | 2.1 | NASA WB-57F | HIRAD | 2015-08-30 to 2015-10-23 |
N: 37.8755 S: 12.8279 E: -63.0352 W: -109.283 |
netCDF-3 | |
| TROPICS01 Pathfinder L2B Instantaneous Surface Rain Rate (ISRR) V1.0 | 1.0 | TROPICS/01 | TMS | 2021-08-07 to 2023-12-17 |
N: 90 S: -90 E: 180 W: -180 |
||
| TROPICS01 Pathfinder L2B Precipitation Ice Water Path (PIWP) V1.0 | 1.0 | TROPICS/01 | TMS | 2021-11-01 to 2023-12-15 |
N: 90 S: -90 E: 180 W: -180 |
||
| TROPICS03 L2B Instantaneous Surface Rain Rate (ISRR) V1.0 | 1.0 | TROPICS/03 | TMS | 2023-06-02 to 2025-11-11 |
N: 90 S: -90 E: 180 W: -180 |
||
| TROPICS05 L2B Instantaneous Surface Rain Rate (ISRR) V0.2 | 0.2 | TROPICS/05 | TMS | 2023-06-01 to 2025-11-05 |
N: 90 S: -90 E: 180 W: -180 |
||
| TROPICS06 L2B Instantaneous Surface Rain Rate (ISRR) V1.0 | 1.0 | TROPICS/06 | TMS | 2023-06-02 to 2025-03-15 |
N: 90 S: -90 E: 180 W: -180 |
||
| Two-Dimensional Video Disdrometer (2DVD) IMPACTS V1 | 1 | GROUND STATIONS | 2DVD | 2020-01-15 to 2020-02-28 |
N: 37.9543 S: 37.9194 E: -75.4462 W: -75.4912 |
ASCII | |
| UAlbany Micro Rain Radar 2 (MRR-2) IMPACTS | 1 | GROUND STATIONS | MRR | 2020-01-30 to 2023-02-28 |
N: 42.686280387058 S: 42.680376870022 E: -73.813906533108 W: -73.832438962497 |
netCDF-3, netCDF-4 | |
| UAlbany Parsivel IMPACTS | 1 | GROUND STATIONS | DISDROMETERS | 2020-01-30 to 2023-02-28 |
N: 42.6957 S: 42.67091583252 E: -73.804445495605 W: -73.8419 |
netCDF-4 | |
| VEMAP 1: U.S. Climate, 1961-1990 | 1 | NOT APPLICABLE | NOT APPLICABLE | 1961-01-01 to 1990-12-31 |
N: 49 S: 25 E: -67 W: -124.5 |
multiple | |
| VEMAP 1: U.S. Climate Change Scenarios Based on Models with Increased CO2 | 1 | NOT APPLICABLE | NOT APPLICABLE | 1961-01-01 to 1990-12-31 |
N: 49 S: 25 E: -67 W: -124.5 |
multiple | |
| VEMAP 1: U.S. Site Files | 1 | NOT APPLICABLE | NOT APPLICABLE | 1961-01-01 to 1990-12-31 |
N: 49 S: 25 E: -67 W: -124.5 |
Text File | |
| VEMAP 2: Monthly Historical and Future Climate Data, Alaska, USA | 1 | COMPUTERS | Computer | 1922-01-01 to 2100-12-31 |
N: 71.5 S: 53.5 E: -128.5 W: -170.5 |
netCDF-4 | |
| VEMAP 2: U.S. Annual Climate, 1895-1993 | 1 | NOT APPLICABLE | NOT APPLICABLE | 1895-01-01 to 1993-12-31 |
N: 49 S: 25 E: -67 W: -124.5 |
netCDF-3 | |
| VEMAP 2: U.S. Annual Climate Change Scenarios | 1 | NOT APPLICABLE | NOT APPLICABLE | 1994-01-01 to 2100-12-31 |
N: 49 S: 25 E: -67 W: -124.5 |
netCDF-3 | |
| VEMAP 2: U.S. Daily Climate, 1895-1993 | 1 | NOT APPLICABLE | NOT APPLICABLE | 1895-01-01 to 1993-12-31 |
N: 49 S: 25 E: -67 W: -124.5 |
netCDF-3 | |
| VEMAP 2: U.S. Daily Climate Change Scenarios | 1 | NOT APPLICABLE | NOT APPLICABLE | 1994-01-01 to 2100-12-31 |
N: 49 S: 25 E: -67 W: -124.5 |
netCDF-3 | |
| VEMAP 2: U.S. Monthly Climate, 1895-1993, Version 2 | 1 | NOT APPLICABLE | NOT APPLICABLE | 1895-01-01 to 1993-12-31 |
N: 49 S: 25 E: -67 W: -124.5 |
netCDF-3 |
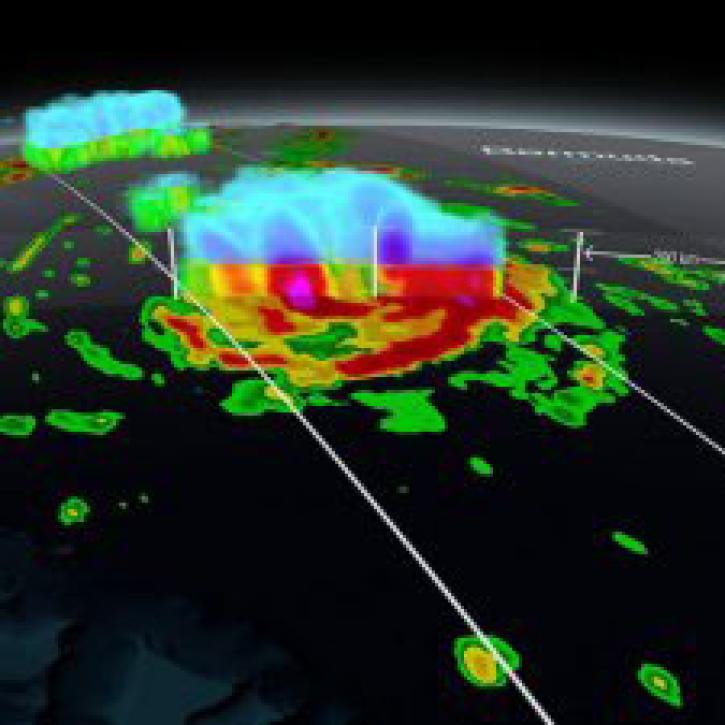
Featured Precipitation Observation Method: GPM
NASA's Global Precipitation Measurement (GPM) platform provides next-generation global observations of rain and snow to help researchers better understand Earth's water and energy cycles and forecast extreme weather and related events.
During this webinar we will provide an overview of TRMM and GPM precipitation data products and discuss the various ways to discover and access these data. We will also demonstrate the visualization and analysis tools and services provided by NASA's Goddard Earth Science Data and Information Services Center (GES DISC).
NASA’s global precipitation data and data processing systems have come a long way from the launch of TRMM in 1997 to the ongoing GPM mission.
9 MIN READ
Frequently Asked Questions
Earthdata Forum
Our online forum provides a space for users to browse thousands of FAQs about research needs, data, and data applications. You can also submit new questions for our experts to answer.
Submit Questions to Earthdata Forumand View Expert Responses