
What is rain?

Rain occurs when water vapor in the atmosphere condenses into liquid droplets and then falls to Earth due to gravity. Rain drives the global water cycle that provides moisture to soils supporting the growth of plants, replenishes surface water such as ponds and lakes, and regulates the planet’s climate. But it can also become a hazard, as intense periods of rainfall can lead to flooding that can threaten both life and property.

How do we monitor rain?

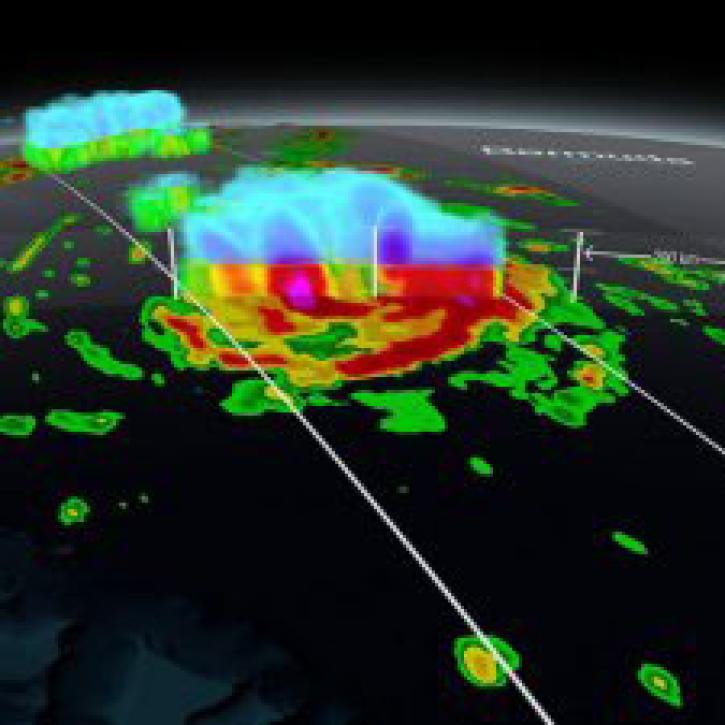
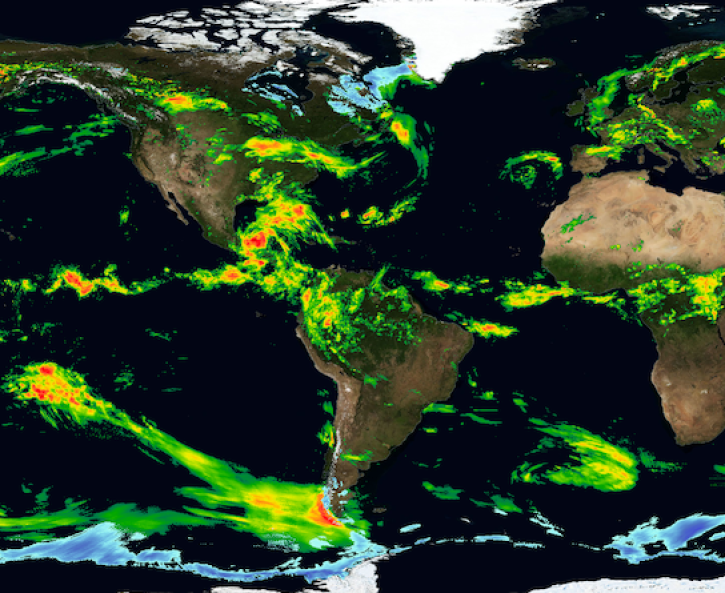
Keeping track of rainfall around the globe is important for environmental science, weather predictions, climate risk management, and countless other fields. The Global Precipitation Measurement (GPM) mission, a joint project between NASA and the Japanese Aerospace Exploration Agency (JAXA), is outfitted with a dual-frequency radar that can record a three-dimensional picture of rainfall moving through the atmosphere. GPM emits pulses of Ku- and Ka-band radar, and can use the timing at which those pulses are returned from water droplets to analyze the rate and type of precipitation. 

The Suomi-NPP mission also observes global precipitation patterns in detail using the Advanced Technology Microwave Sounder (ATMS) and Cross-track Infrared Sounder (CrIS). These satellite rain data are also validated using rain gauges — instruments on Earth’s surface that measure the volume and frequency of rain over time.

What can we do with rain data? 

Rain data have varied and diverse uses, from helping to identify flood or drought conditions to supporting climate modeling to developing more robust weather forecasts.

NASA provides a wide range of tutorials, resources, and training on finding and using precipitation data, some of which can be accessed through the NASA Global Precipitation Mission homepage

Get Rain Data

Access a range of datasets and data tools to further your rain research.

Learn How to Use Rain Data

Access a range of webinars, tutorials, data recipes, and data stories to enhance your knowledge of Earth observation data.
This image of Hurricane Gonzalo approaching Bermuda on October 16, 2014, was created with GPM’s Dual-frequency Precipitation Radar and shows a 3-D view of the storm’s structure.
From TRMM to GPM: The Evolution of NASA Precipitation Data
NASA’s global precipitation data and data processing systems have come a long way from the launch of TRMM in 1997 to the ongoing GPM mission.
Global map shows precipitation data for June 3, 2020, from NASA’s Integrated Multi-satellitE Retrievals for GPM (IMERG) algorithm.
Explore 20 Years of Rain and Snowfall Data from NASA's Precipitation Missions
A new data product merges data from the Tropical Rainfall Measuring Mission (TRMM) and the Global Precipitation Measurement (GPM) mission, giving meteorologists and researchers access to a 20-year precipitation record.
ARSET Introduction to Global Precipitation Measurement (GPM) Data and Applications thumbnail image
Introduction to Global Precipitation Measurement (GPM) Data and Applications
This ARSET training introduces participants to data and applications of the Global Precipitation Measurement mission.
ARSET Assessing Extreme Weather Statistics using NASA Earth eXchange Global Daily Downscaled Projections (NEX-GDDP-CMIP6)  thumbnail image
Assessing Extreme Weather Statistics using NASA Earth eXchange Global Daily Downscaled Projections (NEX-GDDP-CMIP6)
This ARSET training focuses on assessing projected statistics of extreme heat and cold wave events and extreme precipitation excess and deficit events.
Discover and Visualize Rain Data
NASA data help us understand Earth's changing systems in more detail than ever before, and visualizations help make Earth science concepts accessible, beautiful, and impactful.
Data visualization is a powerful tool for analysis, trend and pattern recognition, and communication. Our resources help you find data visualizations to complement and enhance your research. We also have tools and tutorials to help you translate rain data into compelling visuals.
Image
True-color corrected reflectance image from the VIIRS instrument aboard the Suomi NPP satellite overlaid with IMERG Precipitation Rate showing heavy rains and snow over Central Europe
This true-color corrected reflectance image is overlaid with IMERG Precipitation Rate to show the heavy rains and snow that hit Central Europe on April 16, 2025. The data come from the Visible Infrared Imaging Radiometer Suite (VIIRS) instrument aboard the Suomi NPP platform.

Join Our Community of NASA Data Users

While NASA data are openly available without restriction, an Earthdata Login is required to download data and to use some tools with full functionality.

Learn About the Benefits of Earthdata Login

Frequently Asked Questions

Earthdata Forum

Our online forum provides a space for users to browse thousands of FAQs about research needs, data, and data applications. You can also submit new questions for our experts to answer.

Submit Questions to Earthdata Forumand View Expert Responses

Earthdata
Forum