We are in the process of migrating all NASA Earth science data sites into Earthdata from now until end of 2026. Not all NASA Earth science data and resources will appear here until then. Thank you for your patience as we make this transition.
Read about the Web Unification Project
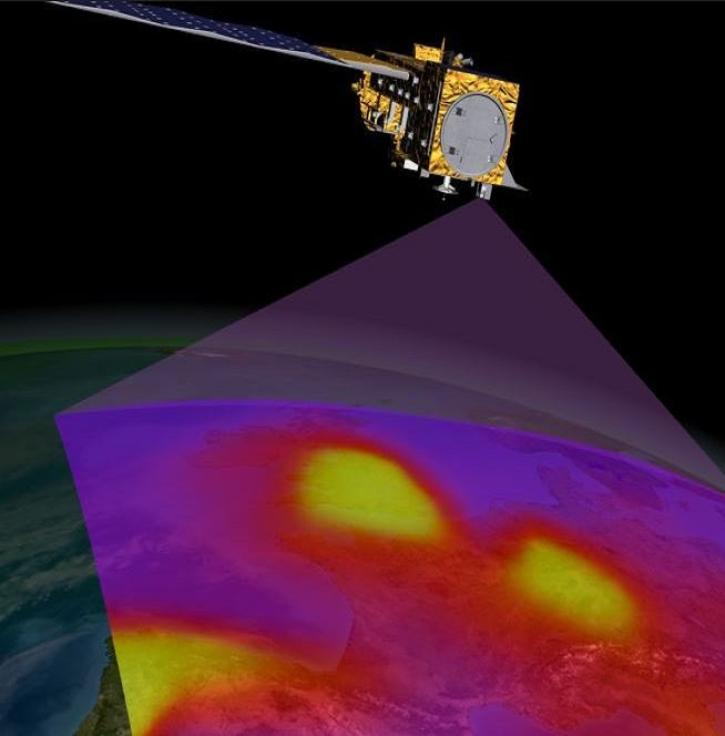
Sulfur Dioxide Data Access and Tools
Commonly Used Sulfur Dioxide Data at a Glance
The following sections will help guide you to topic-specific data and resources for accessing, visualizing, preparing/manipulating (e.g. subsetting), and analyzing data. Each observation, model, and reanalysis data has unique characteristics that should be considered when evaluating its use.
An asterisk (*) next to an entry indicates that near real-time (NRT) data products are available through NASA's Land, Atmosphere Near real-time Capability for EOS (LANCE). While not intended for scientific research, NRT data are good resources for monitoring ongoing or time-critical events. To learn more about the difference between NRT and Standard Science Products, see Near Real Time versus Standard Products.
| Spatial Resolution | Spatial Coverage | Temporal Resolution | Temporal Coverage | Spectral Resolution | Satellite/ Platform | Name (Sensor, Model, etc.) | Observation, Model, or Reanalysis | File Format |
|---|---|---|---|---|---|---|---|---|
| 50 km x 50 km | Global | 6 minutes | 2002-2023 | 2,378 infrared channels in the 3.74-15.4 micron spectral range | Aqua | *AIRS | Observation | HDF-EOS |
| 13 km x 24 km, 0.25°, 1° | Global | 98 minutes, Daily | 2004-present | 1.0-0.45 nm Full Width and Half Maximum (FWHM) | Aura | Ozone Monitoring Instrument (OMI) | Observation | HDF-EOS5 |
| 7.5 km x 3 km | Global | 101 minutes, Daily | 2018 | 250-420 nm | NASA/NOAA Suomi National Polar-orbiting Partnership (Suomi NPP) | Ozone Mapping and Profiler Suite (OMPS) | Observation | netCDF-4 |
| 7 x 3.5 km for all spectral bands, with the exception of the UV1 band (7 x 28 km2) and SWIR bands (7 x 7 km2) | Global | Daily | 2017-present | 270 nm-2.3 µm, 0.55 nm | ESA Sentinel-5P | TROPOspheric Monitoring Instrument (TROPOMI) | Observation | netCDF |
| 165 km x 3 km | Near-global (-82º to +82º latitude) | 15 minutes, Twice daily [day, night] | 2021-present | 190 and 240 GHz | Aura | *MLS | Observation | HDF-EOS5 |
| 0.5° x 0.625° | Global | Hourly, 3 hourly, Monthly | 1980-present | N/A | N/A | MERRA-2 | Reanalysis | netCDF |
| 0.25º x 0.25° | Global | 15 min, Hourly | Daily 5-day forecast | N/A | N/A | GEOS-CF | Model | netCDF |
| 0.25º x 0.312° | Global | 3-hourly | Near-real time assimilation (DAS), 10-day forecast at 00z, and 5-day forecast at 12z | N/A | N/A | GEOS FP | Analysis | netCDF |
| Point measurements | Global | Periodic flights occurred during each deployment | 2016-2018 | varies | Airborne Field Campaign | Atmospheric Tomography Mission (ATom) campaign with varying instruments | Observation | netCDF |
Sulfur Dioxide Datasets
| Dataset | Version Sort ascending | Platforms | Instruments | Temporal Extent | Spatial Extent | Spatial Resolution | Data Format |
|---|---|---|---|---|---|---|---|
| SAFARI 2000 JRA Aerocommander Trace Gas, Aerosol, and CCN Data, Dry Season 2000 | 1 | AC-680E | IR CO2 ANALYZER, HUMIDITY SENSORS, THERMOCOUPLES, PRESSURE SENSORS, CNC, UV OZONE DETECTORS, CHEMILUMINESCENCE, FLUORESCENCE SPECTROSCOPY | 2000-08-15 to 2000-09-07 |
N: -17.8293 S: -30.1916 E: 33.1635 W: 22.156 |
ASCII | |
| CAMP2Ex Merge Data Files | 1 | NASA P-3 | Computer | 2019-08-22 to 2019-10-07 | ICARTT, ZIP | ||
| DISCOVER-AQ Maryland Deployment Aldino Ground Site Data | 1 | GROUND STATIONS | GAS SENSORS, AEROSOL MONITOR | 2011-06-17 to 2011-08-02 | ICARTT | ||
| NARSTO EPA Supersite (SS) Houston, Texas Air Quality Study 2000 (TexAQS2000) Department of Energy (DOE) G-1 Air Chemistry, Aerosol, and Met Data | 1 | AIRCRAFT | BAROMETERS, NDIR GAS ANALYZER, TEMPERATURE PROBES, UV OZONE DETECTORS, HPLC, PYRANOMETERS, HYGROMETERS, CHEMILUMINESCENCE, ION CHROMATOGRAPHS, GUST PROBES, FLUOROMETERS, PHOTOMETERS | 2000-08-19 to 2000-09-12 | ASCII | ||
| ABLE-2B Electra In-Situ Trace Gas Data | 1 | NASA ELECTRA | GRAB SAMPLERS, CHEMILUMINESCENCE, Harvard CO2 | 1987-04-01 to 1987-05-15 |
N: 37.54 S: -84.1 E: -31.29 W: -81.47 |
GTE | |
| KORUS-AQ DC-8 Aircraft In Situ Trace Gas Data | 1 | NASA DC-8 | LI-6252, GC-MS, TD-LIF, DACOM, CAMS, 4STAR, CIMS, CIT-ToF-CIMS, ACES, CHEMILUMINESCENCE, PTR-MS | 2016-04-16 to 2016-06-21 | ICARTT | ||
| PEM Tropics B DC-8 In-Situ Trace Gas Data | 1 | NASA DC-8 | DACOM, GAS CHROMATOGRAPHS, GRAB SAMPLERS, LIQUID CHROMATOGRAPHS, ION CHROMATOGRAPHS, LIF-NO, CHEMILUMINESCENCE | 1999-02-20 to 1999-04-19 |
N: 40 S: -36.35 E: 180 W: -180 |
GTE | |
| NARSTO Pacific 2001 Air Quality Study (PAC2001) Greater Vancouver Regional District (GVRD) and and Canadian Air and Precipitation Monitoring Network (CAPMoN) Supplemental Air Quality Data | 1 | GROUND STATIONS | TEMPERATURE PROBES, UV OZONE DETECTORS, GAS CHROMATOGRAPHS, TEOM, CHEMILUMINESCENCE, ION CHROMATOGRAPHS, HUMIDITY SENSORS, WIND MONITOR | 2001-01-01 to 2002-01-01 | ASCII | ||
| SAFARI 2000 JRB Aerocommander Trace Gas and Aerosol Data, Dry Season 2000 | 1 | AC-680E | IR CO2 ANALYZER, HUMIDITY SENSORS, THERMOCOUPLES, PRESSURE SENSORS, CNC, UV OZONE DETECTORS, CHEMILUMINESCENCE, FLUORESCENCE SPECTROSCOPY | 2000-08-15 to 2000-09-07 |
N: -17.8293 S: -30.1916 E: 33.1635 W: 22.156 |
ASCII | |
| DISCOVER-AQ California Deployment Porterville Ground Site Data | 1 | GROUND STATIONS | CAPS PMex Monitor, MPL, TSI-3563 Neph, MFRSR, UC Davis RDI, SMPS, TEMPERATURE SENSORS, PRESSURE SENSORS | 2013-01-07 to 2013-02-21 | HDF5, ICARTT |
SHOWING 10 OF 168
Featured Sulfur Dioxide Observation Method: OMPS
The Ozone Mapping and Profiler Suite (OMPS) aboard the joint NASA/NOAA Suomi National Polar-orbiting Partnership (Suomi NPP) satellite tracks the health of Earth's ozone layer and measures the concentration of atmospheric ozone. The NOAA-20 and NOAA-21 satellites are also equipped with the instrument. Total column sulfur dioxide data from OMPS are available on a near real-time basis.


OMPS SIPS is responsible for processing, reprocessing, production and general assessment of Suomi NPP VIIRS OMPS Nadir products.
Data from the next-generation Instruments will help atmospheric scientists advance air quality measurements and standards.
20 MIN READ
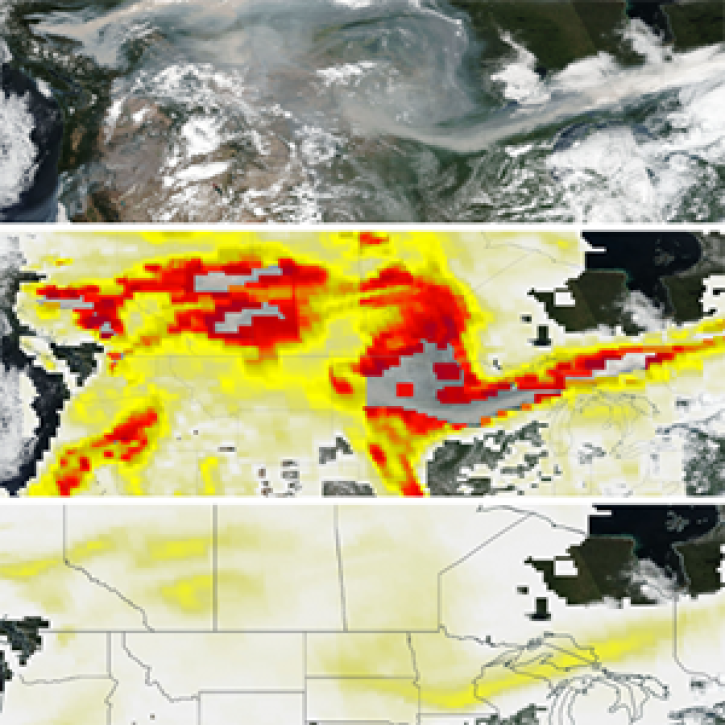
The new PyroCumuloNimbus product for the Ozone Mapping and Profiler Suite (OMPS) makes it easier to track and analyze high concentrations of aerosols from wildfires and similar events.
4 MIN READ
Frequently Asked Questions
Earthdata Forum
Our online forum provides a space for users to browse thousands of FAQs about research needs, data, and data applications. You can also submit new questions for our experts to answer.
Submit Questions to Earthdata Forumand View Expert Responses