We are in the process of migrating all NASA Earth science data sites into Earthdata from now until end of 2026. Not all NASA Earth science data and resources will appear here until then. Thank you for your patience as we make this transition.
Read about the Web Unification Project
Industrial Emissions Data Access and Tools
From discovery to visualization, data tools such as Earthdata Search, Panoply, and Worldview guide users in making the most of data related to greenhouse gas and industrial emissions.
Industrial Emissions Datasets
| Dataset Sort descending | Version | Platform | Instrument | Temporal Extent | Spatial Extent | Spatial Resolution | Data Format |
|---|---|---|---|---|---|---|---|
| Anthropogenic Carbon Emission System, 2012-2017, Version 2 | 2 | COMPUTERS | Computer | 2012-01-01 to 2018-01-01 |
N: 48.1089 S: 23.0132 E: -65.3066 W: -128.267 |
netCDF-4 | |
| ATom: Merged Atmospheric Chemistry, Trace Gases, and Aerosols | 1.5 | NASA DC-8 | PALMS, WAS, LASER SPECTROMETER, SPECTROMETERS, CIMS, PHOTOMETERS | 2016-07-29 to 2018-05-21 |
N: 90 S: -90 E: 180 W: -180 |
netCDF-4 | |
| ATom: Merged Atmospheric Chemistry, Trace Gases, and Aerosols, Version 2 | 2.0 | NASA DC-8 | FLUORESCENCE SPECTROSCOPY, GAS CHROMATOGRAPHS, ION CHROMATOGRAPHS, UCATS-GC, TOGA, DMT SP2, PALMS, PICARRO G2401-mc CO2, CH4, CO, H2O INSTRUMENT, MMS, WAS, AMS, CIMS, DLH, CAPS, CAFS, ATHOS | 2016-07-29 to 2018-05-21 |
N: 82.9406 S: -86.1769 E: 180 W: -180 |
netCDF-4 | |
| AVIRIS-3 L2B Greenhouse Gas Enhancements, Facility Instrument Collection | 1 | G-III, G-V, NASA ER-2, B-200 | AVIRIS-3 | 2023-07-05 to Present |
N: 72.6 S: 16.5 E: -66.18 W: -178.68 |
multiple | |
| CMS: Atmospheric Methane Concentrations and Prior Emissions, Boston, MA, 2012-2014 | 1 | FIELD INVESTIGATION | SPECTROMETERS | 2012-09-01 to 2014-06-30 |
N: 43.2 S: 41.5 E: -70 W: -72.2 |
CSV | |
| CMS GOSAT and ObsPack L4 Top-down yearly methane emissions for individual sectors at 0.5x0.625 degrees for North America V1 (CMS_GO_CH4_SEC_TDYC_NA) | 1 | GOSAT | TANSO-FTS | 2010-01-01 to 2017-12-31 |
N: 65 S: 15 E: -55 W: -130 |
0.625 Decimal Degrees x 0.5 Decimal Degrees | |
| Longwave-infrared spectral imagery in support of COMEX, 2014 | 1 | AIRCRAFT | HSI, Mako | 2014-07-22 to 2014-07-25 |
N: 35.4969 S: 33.8929 E: -117.452 W: -119.941 |
multiple | |
| NACP MCI: CO2 Emissions Inventory, Upper Midwest Region, USA., 2007 | 1 | NOT APPLICABLE | NOT APPLICABLE | 2007-01-01 to 2007-12-31 |
N: 50 S: 36 E: -81 W: -105 |
multiple | |
| STAQS AVIRIS-NG-derived Methane and Carbon Dioxide Plumes, 2023 | 1 | G-III | AVIRIS-NG | 2023-06-26 to 2023-08-15 |
N: 43.6502 S: 33.7137 E: -73.0945 W: -119.678 |
multiple | |
| Vulcan: High-Resolution Annual Fossil Fuel CO2 Emissions in USA, 2010-2015, Version 3 | 1 | MODELS | Computer | 2010-01-01 to 2016-01-01 |
N: 73.7533 S: 22.8582 E: -65.3082 W: -165.214 |
netCDF-4 classic | |
| Vulcan: High-Resolution Hourly Fossil Fuel CO2 Emissions in USA, 2010-2015, Version 3 | 1 | MODELS | Computer | 2010-01-01 to 2016-01-01 |
N: 73.7533 S: 22.8582 E: -65.3082 W: -165.214 |
netCDF-4 classic |
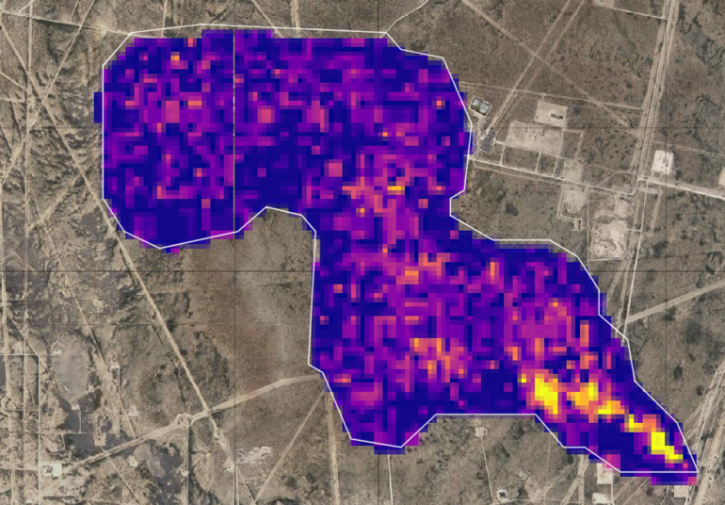
Featured Observation Method: EMIT Imaging Spectrometer
NASA's Earth Surface Mineral Dust Source Investigation (EMIT) Imaging Spectrometer detects high concentrations of greenhouse gases, including carbon dioxide and methane, providing essential data on air pollution.
This 2-hour virtual workshop on March 14, 2024, demonstrates how to use methane data products from NASA's Earth Surface Mineral Dust Source Investigation (EMIT) mission.
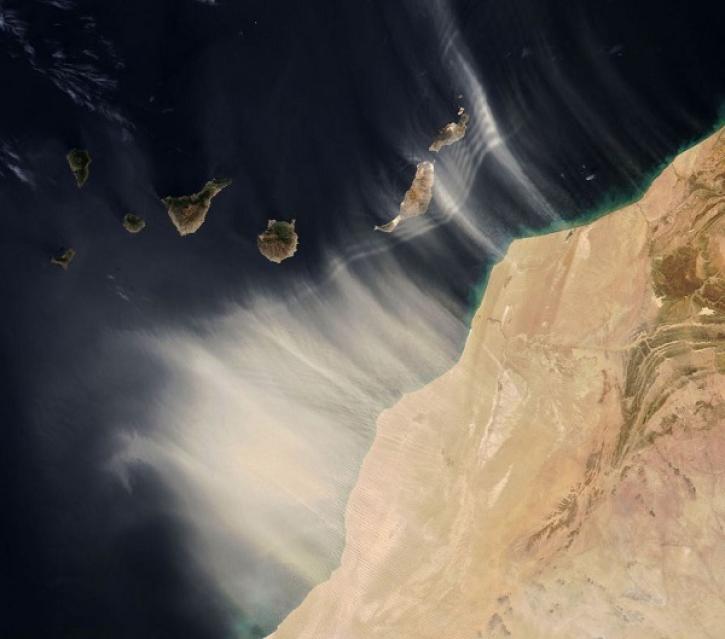
Data from the EMIT instrument help scientists better understand the role mineral dust plays in heating and cooling the atmosphere.
8 MIN READ
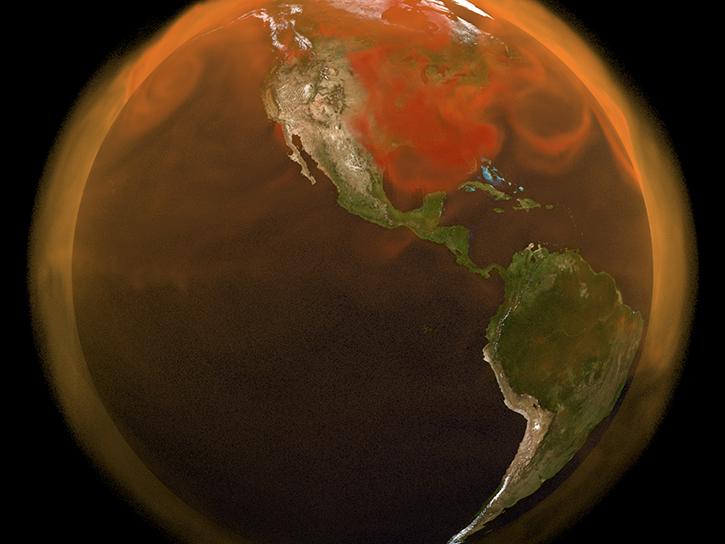
New carbon dioxide and methane data, expanded spatial and temporal resolution for several datasets, and an enhanced data exploration environment are some of the updates in this beta release.
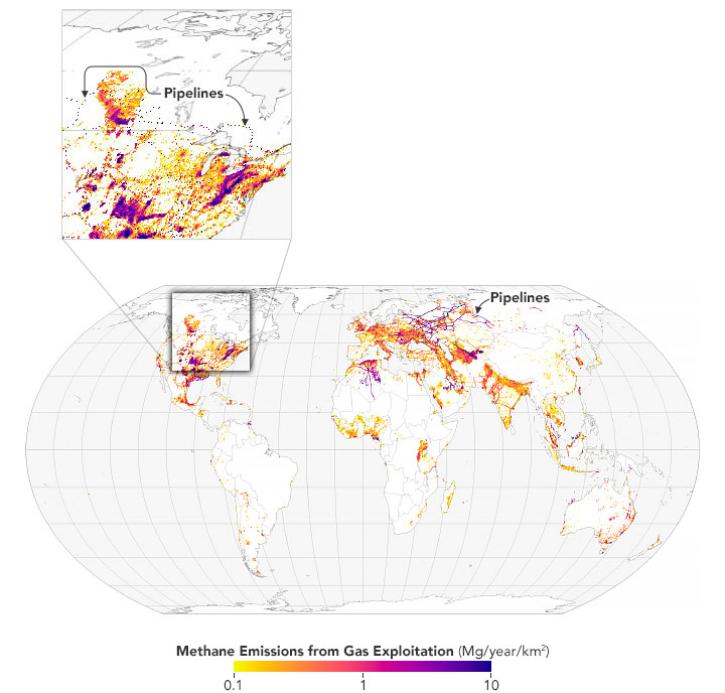
Scientists map 97 million metric tons of methane emissions from the exploitation of oil, natural gas, and coal.
4 MIN READ
Frequently Asked Questions
Earthdata Forum
Our online forum provides a space for users to browse thousands of FAQs about research needs, data, and data applications. You can also submit new questions for our experts to answer.
Submit Questions to Earthdata Forumand View Expert Responses