We are in the process of migrating all NASA Earth science data sites into Earthdata from now until end of 2026. Not all NASA Earth science data and resources will appear here until then. Thank you for your patience as we make this transition.
Read about the Web Unification Project
Soils Data Access and Tools
Soils Datasets
| Dataset Sort descending | Version | Platform | Instrument | Temporal Extent | Spatial Extent | Spatial Resolution | Data Format |
|---|---|---|---|---|---|---|---|
| A Compilation of Global Soil Microbial Biomass Carbon, Nitrogen, and Phosphorus Data | 1 | NOT APPLICABLE | NOT APPLICABLE | 1977-11-16 to 2012-06-01 |
N: 79 S: -90 E: 177.9 W: -180 |
multiple | |
| A Global Database of Gas Fluxes from Soils after Rewetting or Thawing, Version 1.0 | 1 | FIELD INVESTIGATION | LICOR SOIL GAS CHAMBER | 1956-01-01 to 2009-12-31 |
N: 74.5 S: -36.45 E: 160.525 W: -149.633 |
CSV | |
| A Global Database of Soil Phosphorus Compiled from Studies Using Hedley Fractionation | 1 | NOT APPLICABLE | NOT APPLICABLE | 1985-01-01 to 2010-12-31 |
N: 63.2336 S: -42.5 E: 117.596 W: -117.861 |
CSV | |
| A Global Database of Soil Respiration Data, Version 5.0 | 5 | FIELD INVESTIGATION | LICOR GAS EXCHANGE SYSTEM, LICOR SOIL GAS CHAMBER | 1961-01-01 to 2017-12-31 |
N: 81.8 S: -78.02 E: 175.897 W: -163.71 |
CSV | |
| ABCFlux v2: Arctic-Boreal CO2 and CH4 In-situ Flux and Environmental Data | 1 | FIELD SURVEYS | SOIL MOISTURE PROBE, SOIL TEMPERATURE PROBE, SURVEYING TOOLS, EDDY CORRELATION DEVICES | 1984-05-01 to 2024-12-31 |
N: 82.8226 S: 43.323 E: 161.843 W: -165.833 |
CSV | |
| ABoVE: Active Layer and Soil Moisture Properties from AirMOSS P-band SAR in Alaska | 1 | G-III, MODELS | RADAR, Computer | 2014-08-16 to 2017-10-10 |
N: 70.8774 S: 64.7127 E: -150.249 W: -167.944 |
netCDF-4 classic | |
| ABoVE: Active Layer Soil Characteristics at Selected Sites Across Alaska | 1 | FIELD SURVEYS | CORING DEVICES | 2016-08-09 to 2018-07-07 |
N: 68.5596 S: 63.8801 E: -146.558 W: -149.533 |
multiple | |
| ABoVE: Active Layer Soil Characterization of Permafrost Sites, Northern Alaska, 2018 | 1 | LABORATORY, FIELD SURVEYS | BALANCE, SOIL DEPTH PROBE | 2018-08-22 to 2018-08-26 |
N: 69.8124 S: 68.605 E: -148.564 W: -149.306 |
CSV | |
| ABoVE: Active Layer Thickness from Airborne L- and P- band SAR, Alaska, 2017, Ver. 3 | 3 | GULFSTREAM 1000 (695A) | UAVSAR | 2017-06-19 to 2017-09-16 |
N: 71.5212 S: 57.8294 E: -110.418 W: -166.733 |
multiple | |
| ABoVE: Active Layer Thickness from Remote Sensing Permafrost Model, Alaska, 2001-2015 | 1 | SATELLITES, SMAP | MODIS, SMAP L-BAND RADAR | 2001-01-01 to 2015-12-31 |
N: 70.214 S: 55.5667 E: -132.576 W: -179.18 |
netCDF-4 classic | |
| ABoVE: Alder Shrub Cover and Soil Properties, Alaska, 2019, V2 | 2 | LANDSAT-8, LABORATORY, FIELD INVESTIGATION | OLI, CHN ANALYZERS, IRMS, VISUAL CENSUS TRANSECTS | 2018-08-14 to 2019-08-28 |
N: 68.0185 S: 66.3401 E: -149.708 W: -150.714 |
multiple | |
| ABoVE: Burn Severity, Fire Progression, and Field Data, NWT, Canada, 2015-2016 | 1 | FIELD SURVEYS, Aqua, Terra | SOIL TEMPERATURE PROBE, SOIL MOISTURE PROBE, MODIS | 2015-05-20 to 2016-08-08 |
N: 68.327 S: 59.927 E: -106.759 W: -135.543 |
CSV | |
| ABoVE: Burn Severity, Fire Progression, Landcover and Field Data, NWT, Canada, 2014 | 1 | Terra, FIELD SURVEYS, Aqua | MODIS, SOIL MOISTURE PROBE, SOIL TEMPERATURE PROBE | 1997-07-07 to 2015-07-15 |
N: 64.2509 S: 60.3334 E: -110.677 W: -121.604 |
multiple | |
| ABoVE: Burn Severity of Soil Organic Matter, Northwest Territories, Canada, 2014-2015 | 1 | LANDSAT-8, FIELD SURVEYS, MODELS | OLI, TIRS, GPS, Computer | 2014-05-01 to 2015-10-01 |
N: 65.5514 S: 58.2864 E: -108.834 W: -124.03 |
multiple | |
| ABoVE: Characterization of Burned and Unburned Boreal Forest Stands, SK, Canada, 2016 | 1 | FIELD SURVEYS, MODELS | STEEL MEASURING TAPE, SOIL SAMPLER, CLINOMETERS, GPS, Computer | 2016-05-30 to 2016-06-16 |
N: 57.3646 S: 54.091 E: -104.693 W: -109.173 |
CSV | |
| ABoVE: Characterization of Burned and Unburned Spruce Forest Sites, Tanana, AK, 2017 | 1 | FIELD SURVEYS, LANDSAT | PROBES, SOIL MOISTURE PROBE, TM | 2017-07-26 to 2017-07-28 |
N: 65.2315 S: 65.0968 E: -151.951 W: -152.416 |
CSV | |
| ABoVE: Characterization of Carbon Dynamics in Burned Forest Plots, NWT, Canada, 2014 | 1 | FIELD SURVEYS, MODELS, LABORATORY | CLINOMETERS, Computer, MASS SPECTROMETERS | 2015-06-14 to 2015-06-14 |
N: 71.6947 S: 56.2542 E: -102 W: -136.119 |
CSV | |
| ABoVE: CO2 and CH4 Fluxes and Meteorology at Flux Tower Sites, Alaska, 2015-2017 | 1 | FIELD SURVEYS, GROUND STATIONS, METEOROLOGICAL STATIONS | PROBES, NET RADIOMETERS, LICOR QUANTUM SENSOR, THERMOCOUPLES, EDDY CORRELATION DEVICES, PYRANOMETERS | 2015-01-01 to 2017-03-09 |
N: 71.282 S: 68.4864 E: -155.75 W: -157.41 |
CSV | |
| ABoVE: Ignitions, Burned Area, and Emissions of Fires in AK, YT, and NWT, 2001-2018 | 2 | Aqua, MODELS | MODIS, Computer | 2001-01-01 to 2018-12-31 |
N: 79.2618 S: 51.6346 E: -99.9838 W: -167 |
multiple | |
| ABoVE: Land Cover, Methane Flux, and Environmental Data, Big Trail Lake, Fairbanks AK | 1 | MODELS, FIELD INVESTIGATION | Computer, SOIL MOISTURE PROBE | 2017-05-28 to 2022-08-23 |
N: 64.9231 S: 64.9201 E: -147.816 W: -147.825 |
multiple | |
| ABoVE: Light-Curve Modelling of Gridded GPP Using MODIS MAIAC and Flux Tower Data | 1 | Terra, MODELS, METEOROLOGICAL STATIONS, AQUA | MODIS, Computer, MMS | 2000-01-01 to 2018-01-01 |
N: 79.7489 S: 50.0604 E: -73.6407 W: -172.078 |
HDF4 | |
| ABoVE: Monthly Hydrological Fluxes for Canada and Alaska, 1979-2018 | 1 | MODELS | Computer | 1979-01-01 to 2018-04-01 |
N: 83.125 S: 41.7508 E: -53.4255 W: -172.25 |
multiple | |
| ABoVE: Multi-model Uncertainty of Carbon Stocks and Fluxes across ABoVE Domain, 2003 | 1 | MODELS | Computer | 2003-01-01 to 2003-12-31 |
N: 81.4094 S: 39.4094 E: -67.1247 W: -176.125 |
GeoTIFF | |
| ABoVE: Permafrost Measurements and Distribution Across the Y-K Delta, Alaska, 2016 | 1 | IKONOS, FIELD SURVEYS, Airplane | Schmidt-Cassegrain Telescope, SOIL DEPTH PROBE, LIDAR | 2009-06-27 to 2016-07-17 |
N: 61.2881 S: 61.1694 E: -165.03 W: -165.69 |
multiple | |
| ABoVE: Post-Fire and Unburned Field Site Data, Anaktuvuk River Fire Area, 2008-2017 | 1 | FIELD SURVEYS | SOIL DEPTH PROBE, VISUAL OBSERVATIONS | 2008-07-03 to 2017-07-23 |
N: 69.359 S: 69.0189 E: -150.034 W: -151.176 |
CSV |
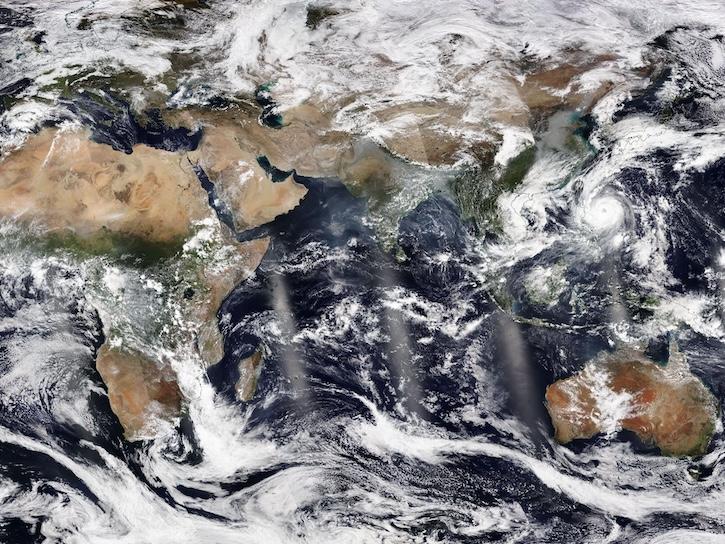
Featured Soils Observation Method: MODIS
The Moderate Resolution Imaging Spectroradiometer (MODIS) aboard the Aqua and Terra platforms continually collects global data approximately every two days. One MODIS product, normalized vegetation difference index data, can be used to predict how much carbon dioxide is emitted from soils, which is major component of the global carbon cycle. Carbon is released in the process called soil respiration and driven by the decomposition of surface litter through microbial activity.
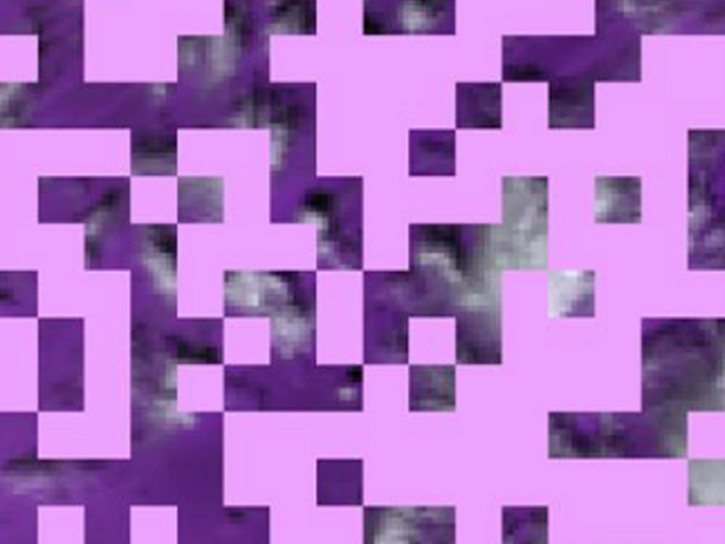
Researchers taught the SatVision Top-of-Atmosphere foundation model to recognize MODIS imagery features.
4 MIN READ
The Visible Infrared Imaging Radiometer Suite (VIIRS) will help ensure continuity of Earth observations after the upcoming retirement of the Moderate Resolution Imaging Spectroradiometer (MODIS).
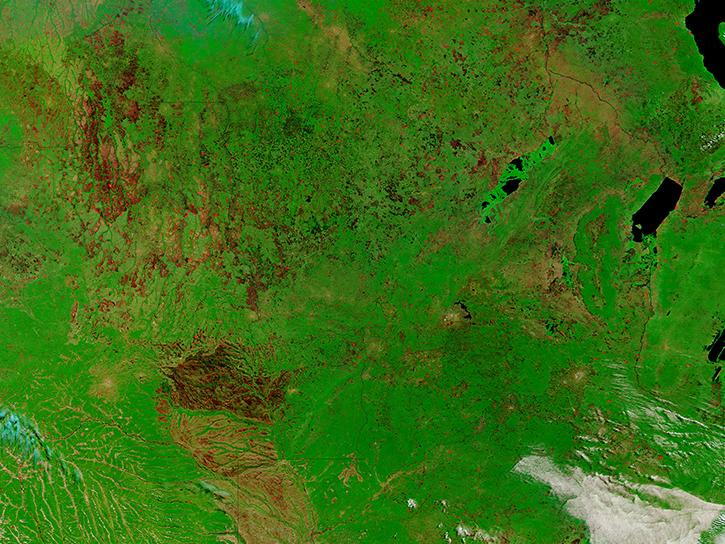
Learn how to access and use Moderate Resolution Imaging Spectroradiometer (MODIS) Version 6 land data.
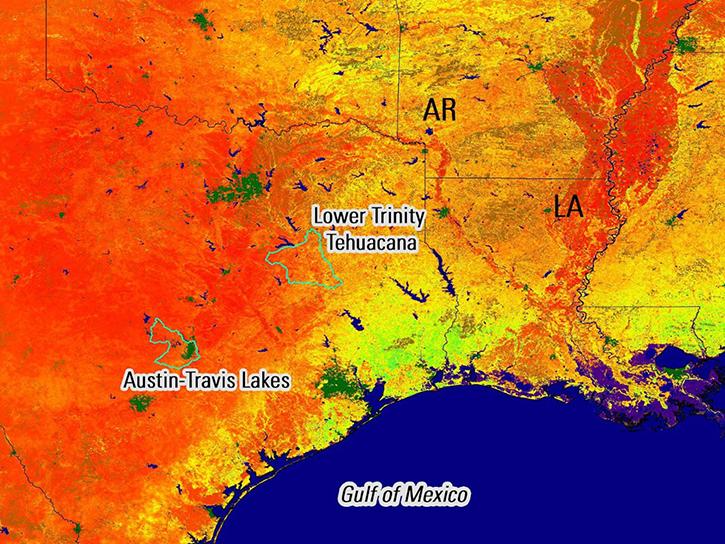
Remote sensing data's drought-indicating parameters are essential to manage the impact of water scarcities and minimize drought losses.
Frequently Asked Questions
Earthdata Forum
Our online forum provides a space for users to browse thousands of FAQs about research needs, data, and data applications. You can also submit new questions for our experts to answer.
Submit Questions to Earthdata Forumand View Expert Responses