We are in the process of migrating all NASA Earth science data sites into Earthdata from now until end of 2026. Not all NASA Earth science data and resources will appear here until then. Thank you for your patience as we make this transition.
Read about the Web Unification Project
Soils Data Access and Tools
Soils Datasets
| Dataset Sort descending | Version | Platform | Instrument | Temporal Extent | Spatial Extent | Spatial Resolution | Data Format |
|---|---|---|---|---|---|---|---|
| LBA-ECO ND-11 Soil Water Pressure and Flow Measurements under Tree Crops | 1 | FIELD INVESTIGATION | TDR, Tensiometer | 1998-01-01 to 1999-12-31 |
N: -3.1347 S: -3.1347 E: -59.88 W: -59.88 |
CSV | |
| LBA-ECO ND-30 Nutrient Analysis and Gas Fluxes, Forest Chronosequences, Para, Brazil | 1 | LABORATORY, FIELD SURVEYS, FIELD INVESTIGATION | CHN ANALYZERS, MASS SPECTROMETERS, CARBON ANALYZERS, GAS CHROMATOGRAPHS, BALANCE | 2000-10-01 to 2005-01-31 |
N: -1.2667 S: -15.9328 E: -47.3667 W: -47.7833 |
CSV | |
| LBA-ECO ND-30 Water Chemistry, Rainfall Exclusion, km 67, Tapajos National Forest | 1 | LABORATORY, FIELD INVESTIGATION | ION CHROMATOGRAPHS, LYSIMETERS | 1999-05-17 to 2006-05-10 |
N: -2.75 S: -2.75 E: -55 W: -55 |
CSV | |
| LBA-ECO TG-05 NPP, Carbon Pool, Soil Characteristics, Soil Gas Flux Maps of Brazil | 1 | NOT APPLICABLE | NOT APPLICABLE | 1982-01-01 to 2001-12-31 |
N: 6.02 S: -34 E: -34.035 W: -80 |
GeoTIFF | |
| LBA-ECO TG-07 Forest Soil P, C, and N Pools, km 83 Site, Tapajos National Forest | 1 | FIELD INVESTIGATION | COLORIMETERS, BALANCE, CARBON ANALYZERS | 1999-04-20 to 2000-04-20 |
N: -3.017 S: -3.017 E: -54.9707 W: -54.9707 |
CSV | |
| LBA-ECO TG-07 Litter Decomposition, Tapajos National Forest, Para, Brazil: 2000-2001 | 1 | LABORATORY, FIELD INVESTIGATION | BALANCE, ICP-AES, CHN ANALYZERS, VISUAL OBSERVATIONS | 2000-03-01 to 2001-02-21 |
N: -3.017 S: -3.017 E: -54.9707 W: -54.9707 |
CSV | |
| LBA-ECO TG-07 Long-Term Soil Gas Flux and Root Mortality, Tapajos National Forest | 1 | LABORATORY, FIELD INVESTIGATION | GC-FID, BALANCE, IR CO2 ANALYZER, AUTOANALYZER | 2000-05-31 to 2001-07-14 |
N: -3.017 S: -3.017 E: -54.9707 W: -54.9707 |
CSV | |
| LBA-ECO TG-07 Soil CO2 Flux by Automated Chamber, Para, Brazil: 2001-2003 | 1 | FIELD INVESTIGATION | THERMOCOUPLES, LICOR GAS EXCHANGE SYSTEM, IRGA | 2001-03-19 to 2003-05-05 |
N: -2.857 S: -2.857 E: -54.959 W: -54.959 |
CSV | |
| LBA-ECO TG-07 Soil Trace Gas Flux and Root Mortality, Tapajos National Forest | 1 | FIELD INVESTIGATION, LABORATORY | BALANCE, THERMOMETERS, TEMPERATURE PROBES, CHEMILUMINESCENCE, IRGA, GAS CHROMATOGRAPHS, GC-FID | 2000-06-04 to 2001-05-15 |
N: -3.017 S: -3.017 E: -54.9707 W: -54.9707 |
CSV | |
| LBA-ECO TG-07 Soil Trace Gas Fluxes km 67 Seca-Floresta Site, Tapajos National Forest | 1 | FIELD INVESTIGATION, LABORATORY | TEMPERATURE PROBES, THERMOMETERS, CHEMILUMINESCENCE, IRGA, GC-FID, GC-ECD | 2000-01-12 to 2004-04-28 |
N: -2.75 S: -2.75 E: -55 W: -55 |
CSV | |
| LBA-ECO TG-07 Trace Gas Fluxes, Undisturbed and Logged Sites, Para, Brazil: 2000-2002 | 1 | LABORATORY, FIELD INVESTIGATION | GC-ECD, BALANCE, GC-FID, THERMOMETERS, TEMPERATURE PROBES, CHEMILUMINESCENCE, IRGA | 2000-01-19 to 2002-02-26 |
N: -3.017 S: -3.017 E: -54.9707 W: -54.9707 |
CSV | |
| LBA-ECO TG-08 Soil Gas Flux after Forest and Pasture Fertilization, Rondonia, Brazil | 1 | FIELD INVESTIGATION | SPECTROPHOTOMETERS, CHEMILUMINESCENCE, AUTOANALYZER, BALANCE, GAS CHROMATOGRAPHS, IRGA | 1998-02-18 to 1999-03-10 |
N: -10.156 S: -10.156 E: -62.811 W: -62.811 |
CSV | |
| LBA-ECO TG-08 Trace Gas Fluxes from Wetted Forest and Pasture Soils, Rondonia, Brazil | 1 | FIELD INVESTIGATION | ION CHROMATOGRAPHS, CHEMILUMINESCENCE, GAS CHROMATOGRAPHS, BALANCE | 1998-08-17 to 1999-08-23 |
N: -10.156 S: -10.156 E: -62.811 W: -62.811 |
CSV | |
| LBA-ECO TG-09 Soil Isotopic C, N, H2O, and N2O Data, Tapajos National Forest, Brazil | 1 | LABORATORY | IRMS, BALANCE | 2000-07-08 to 2002-03-23 |
N: -2.75 S: -3.017 E: -54.9707 W: -55 |
CSV | |
| LINKAGES: An Individual-based Forest Ecosystem Biogeochemistry Model | 1 | METEOROLOGICAL STATIONS | THERMOMETERS, RAIN GAUGES | 1973-01-01 to 2008-12-31 |
N: 90 S: -90 E: 180 W: -180 |
multiple | |
| Lund-Potsdam-Jena Wetland Hydrology and Methane DGV Model (LPJ-WHyMe v1.3.1) | 1 | NOT APPLICABLE | NOT APPLICABLE | 1972-01-01 to 2010-10-15 |
N: 90 S: -60 E: 180 W: -180 |
multiple | |
| Machine learning-based Arctic-boreal terrestrial ecosystem CO2 fluxes, 2001-2020 | 1 | COMPUTERS | Computer | 2001-01-01 to 2020-12-31 |
N: 90 S: 33.68 E: 180 W: -180 |
multiple | |
| Maps of Vegetation Types and Physiographic Features, Toolik Lake Area, Alaska | 1 | COMPUTERS | Computer | 1990-01-01 to 2014-08-31 |
N: 68.6561 S: 68.6169 E: -149.546 W: -149.67 |
Shapefile | |
| MAPSS: Mapped Atmosphere-Plant-Soil System Model, Version 1.0 | 1 | NOT APPLICABLE | NOT APPLICABLE | 1995-01-01 to 1995-01-01 |
N: 90 S: -90 E: 180 W: -180 |
multiple | |
| Mean Annual Fluxes of Carbon in Coastal Ecosystems of Eastern North America | 1 | MODELS | Computer | 1976-01-01 to 2017-12-31 |
N: 45 S: 25 E: -65 W: -85 |
CSV | |
| Mechanistic Module for Soil Nitrogen Emissions for CMAQ Model, North America, 2011 | 1 | MODELS | Computer | 2011-04-21 to 2011-04-21 |
N: 51.5525 S: 25.0697 E: -59.1328 W: -128.742 |
netCDF-3 | |
| MERRA-2 tavg1_2d_lnd_Nx: 2d,1-Hourly,Time-Averaged,Single-Level,Assimilation,Land Surface Diagnostics 0.625 x 0.5 degree V5.12.4 (M2T1NXLND) at GES DISC | 5.12.4 | MERRA-2 | NOT APPLICABLE | 1980-01-01 to Present |
N: 90 S: -90 E: 180 W: -180 |
0.625 Decimal Degrees x 0.5 Decimal Degrees | |
| MERRA-2 tavgM_2d_lnd_Nx: 2d,Monthly mean,Time-Averaged,Single-Level,Assimilation,Land Surface Diagnostics 0.625 x 0.5 degree V5.12.4 (M2TMNXLND) at GES DISC | 5.12.4 | MERRA-2 | NOT APPLICABLE | 1980-01-01 to Present |
N: 90 S: -90 E: 180 W: -180 |
0.625 Decimal Degrees x 0.5 Decimal Degrees | |
| MERRA-2 tavgU_2d_lnd_Nx: 2d,diurnal,Time-Averaged,Single-Level,Assimilation,Land Surface Diagnostics 0.625 x 0.5 degree V5.12.4 (M2TUNXLND) at GES DISC | 5.12.4 | MERRA-2 | NOT APPLICABLE | 1980-01-01 to Present |
N: 90 S: -90 E: 180 W: -180 |
0.625 Decimal Degrees x 0.5 Decimal Degrees | |
| Meteorology (OTTER) | 1 | METEOROLOGICAL STATIONS | BAROMETERS, RAIN GAUGES, THERMOMETERS, PYRANOMETERS | 1989-05-27 to 1991-01-07 |
N: 45.06 S: 44.38 E: -121.68 W: -123.94 |
ASCII |
Featured Soils Observation Method: MODIS
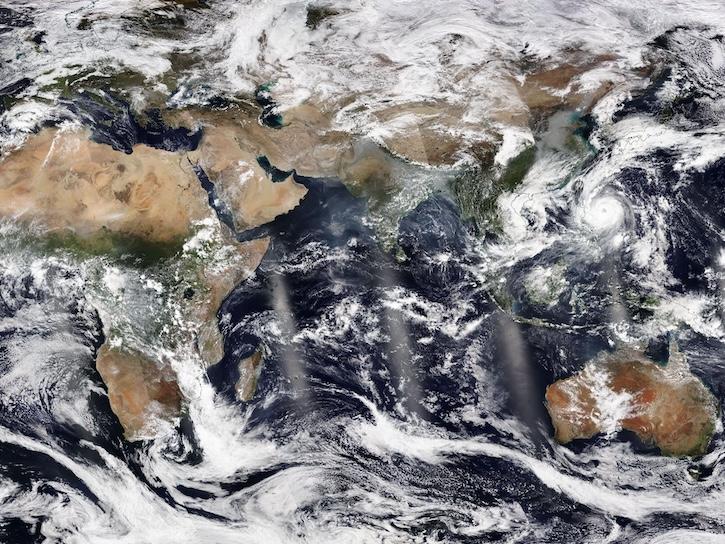
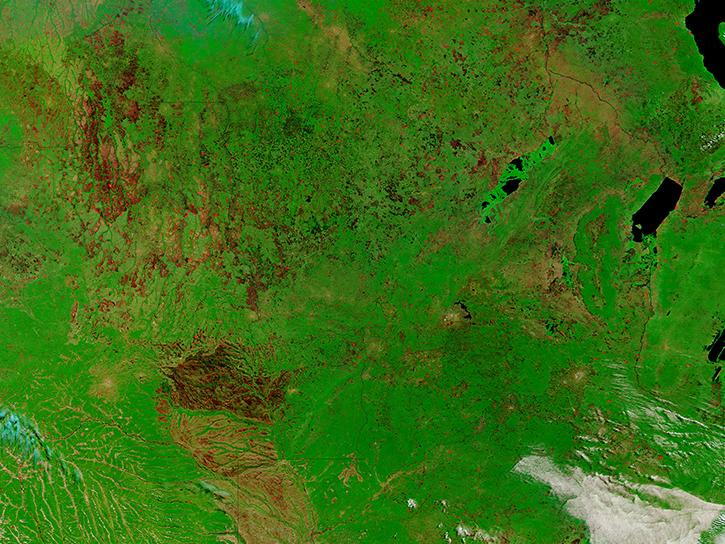
The Moderate Resolution Imaging Spectroradiometer (MODIS) aboard the Aqua and Terra platforms continually collects global data approximately every two days. One MODIS product, normalized vegetation difference index data, can be used to predict how much carbon dioxide is emitted from soils, which is major component of the global carbon cycle. Carbon is released in the process called soil respiration and driven by the decomposition of surface litter through microbial activity.
Researchers taught the SatVision Top-of-Atmosphere foundation model to recognize MODIS imagery features.
4 MIN READ
The Visible Infrared Imaging Radiometer Suite (VIIRS) will help ensure continuity of Earth observations after the upcoming retirement of the Moderate Resolution Imaging Spectroradiometer (MODIS).
Learn how to access and use Moderate Resolution Imaging Spectroradiometer (MODIS) Version 6 land data.
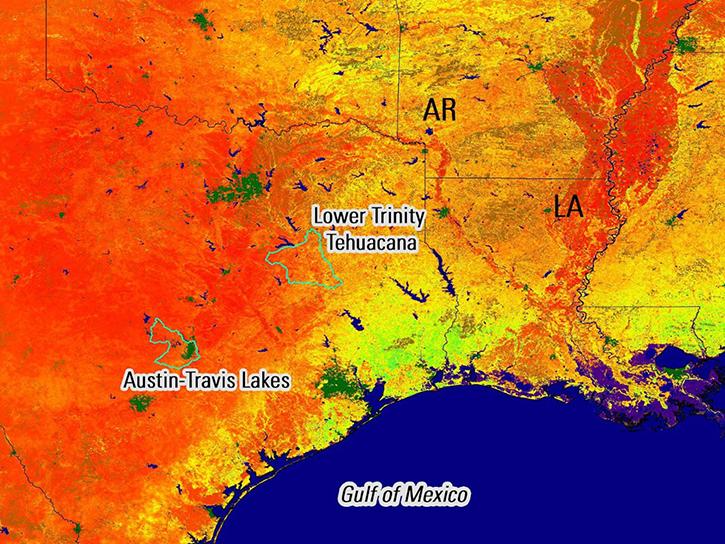
Remote sensing data's drought-indicating parameters are essential to manage the impact of water scarcities and minimize drought losses.
Soils Data Tools
| Tool Sort descending | Description | Services | |
|---|---|---|---|
| Vertex | Vertex is a graphical search interface for finding synthetic aperture radar (SAR) data. | Search and Discovery, Access, Downloading, Processing, Subsetting |
SHOWING 1 OF 1
Frequently Asked Questions
Earthdata Forum
Our online forum provides a space for users to browse thousands of FAQs about research needs, data, and data applications. You can also submit new questions for our experts to answer.
Submit Questions to Earthdata Forumand View Expert Responses