Earth’s shell of solid rock crust is 20 to 80 kilometers thick and floating atop the planet’s molten mantle. The crust is broken up into 15-20 tectonic plates that move toward and away from each other an average of 1.5 centimeters per year. The crust can also move vertically as the weight of glaciers and water expand or recede over them.

NASA collects crustal motion data provided by ground-based and satellite instruments. The data is used for a host of purposes including tectonic plate and earthquake research, calculating crust and sea level height and change, and locating the exact position of points, places, and objects on Earth. A lot of the data is provided by Global Navigation Satellite System (GNSS) spacecraft transmitting from space to ground stations, which means the data can also be used for taking certain atmospheric measurements. For example, water vapor concentration could be calculated to aid in modeling rainfall extent during heavy storms. There’s literally a world of possibilities for using Earth’s crustal motion data.

Get Crustal Motion Data

Access a range of datasets and data tools to further your research.

Learn How to Use Crustal Motion Data
Access a range of webinars, tutorials, data recipes, and data stories to enhance your knowledge of Earth Observation data.
image of sea floor data
Data User Story: Dr. Yehuda Bock
Dr. Bock provides NASA's Crustal Dynamics Data Information System (CDDIS) with data products based on ground displacement data.
VLBI Thumbnail
Beacons in the Sky Help Monitor Earth's Orientation in Space
Measurements of remote celestial objects detail Earth’s orientation in space.
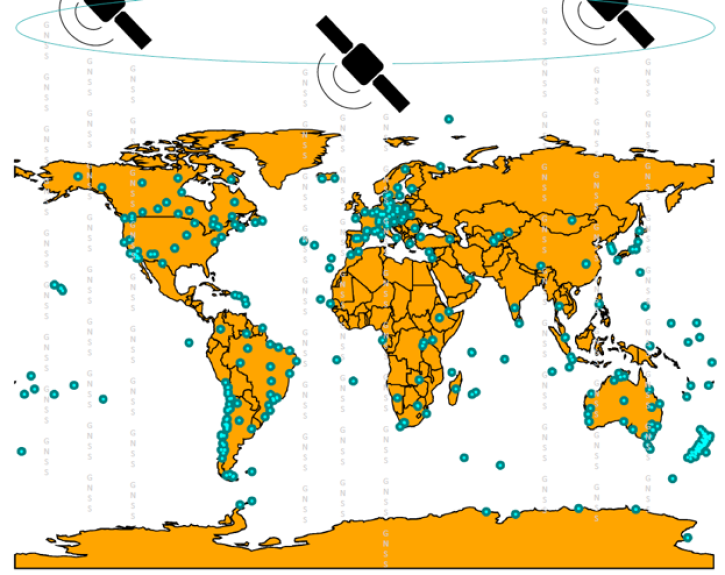
Crustal Dynamics Data Information System webinar banner image showing Global Navigation Satellite System data.avigation
Accessing Real-Time GNSS Data and Derived Products from NASA's CDDIS
learn how to discover and access the real-time Global Navigation Satellite System (GNSS) data.
SLR Thumbnail
Space Geodesy Techniques
Geodesy is the science of the Earth’s shape, gravity, and rotation, including their evolution in time. Learn more about geodetic data and how they enable scientists to track crustal motion.
Discover and Visualize Crustal Motion Data
NASA data help us understand Earth's changing systems in more detail than ever before, and visualizations bring these data to life, making Earth science concepts accessible, beautiful, and impactful.
Data visualization is a powerful tool for analysis, trend and pattern recognition, and communication. Our resources help you find world-class data visualizations to complement and enhance your research. We also have tools and tutorials to help you translate crustal motion data into compelling visuals.
Image
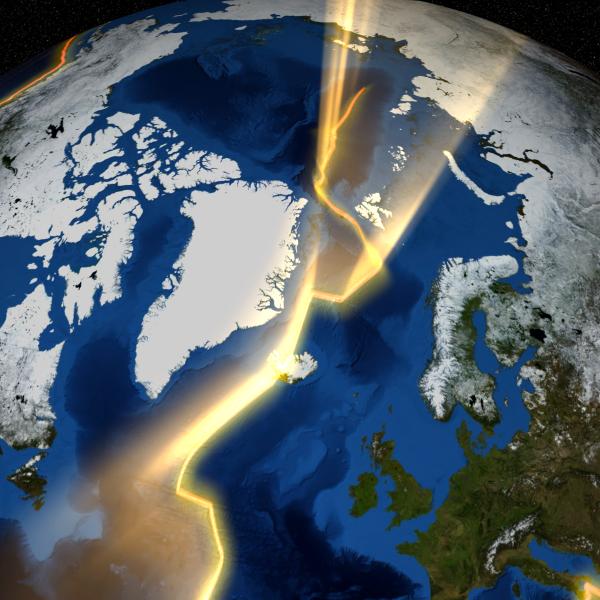
This image shows a thermal track in Greenland's bedrock that reveals the path of the North American tectonic plate that the country is part of over geologic time. The jagged, meandering path is oriented north to south and illustrated in golden glowing light running across the country and through the ocean.
This is a visualization of Greenland's geologic heat flux scar. The scar was caused by the motion of the North American plate under Greenland passing over a magma plume upwelling from Earth's mantle, which scared the country's bedrock. The scar essentially represents the path that the plate has taken over geologic time. The visualization was created using computer modeling and Moderate Resolution Imaging Spectroradiometer (MODIS) data. Credit: NASA’s Goddard Space Flight Center/Dan Gallagher/Ernie Wright

Join Our Community of NASA Data Users

While NASA data are openly available without restriction, an Earthdata Login is required to download data and to use some tools with full functionality.

Learn About the Benefits of Earthdata Login

Frequently Asked Questions

Earthdata Forum

Our online forum provides a space for users to browse thousands of FAQs about research needs, data, and data applications. You can also submit new questions for our experts to answer.

Submit Questions to Earthdata Forumand View Expert Responses

Earthdata
Forum