We are in the process of migrating all NASA Earth science data sites into Earthdata from now until end of 2026. Not all NASA Earth science data and resources will appear here until then. Thank you for your patience as we make this transition.
Read about the Web Unification Project
Atmospheric Temperature Data Access and Tools
NASA has atmospheric temperature datasets that help researchers measure the degree of warmth in various levels of the atmosphere. Access a range of data and data tools such as AppEEARS, Worldview, and Giovanni to make the most of atmospheric temperature data.
Atmospheric Temperature Datasets
| Dataset Sort descending | Version | Platform | Instrument | Temporal Extent | Spatial Extent | Spatial Resolution | Data Format |
|---|---|---|---|---|---|---|---|
| CERES Time-Interpolated TOA Fluxes, Clouds and Aerosols Daily NPP Edition2A | Edition2A | Suomi-NPP | CERES-FM5, VIIRS | 2012-02-01 to Present | HDF4 | ||
| CERES Time-Interpolated TOA Fluxes, Clouds and Aerosols Daily Terra Edition4A | Edition4A | Terra | CERES-FM1, CERES-FM2 | 2000-03-01 to Present | HDF4 | ||
| CERES Time-Interpolated TOA Fluxes, Clouds and Aerosols Monthly Aqua Edition4A | Edition4A | Aqua | CERES-FM4, CERES-FM3 | 2002-07-01 to Present | HDF4 | ||
| CERES Time-Interpolated TOA Fluxes, Clouds and Aerosols Monthly NOAA-20 Edition1B | Edition1B | NOAA-20 | CERES-FM6, VIIRS | 2018-05-01 to Present | HDF4 | ||
| CERES Time-Interpolated TOA Fluxes, Clouds and Aerosols Monthly NOAA-20 Edition1C | Edition1C | NOAA-20 | CERES-FM6, VIIRS | 2018-05-01 to Present | HDF4 | ||
| CERES Time-Interpolated TOA Fluxes, Clouds and Aerosols Monthly Terra Edition4A | Edition4A | Terra | CERES-FM1, CERES-FM2, MODIS | 2000-03-01 to Present | HDF4 | ||
| Circumpolar Arctic Vegetation, Geobotanical, Physiographic Maps, 1982-2003 | 1 | FIELD SURVEYS, LANDSAT-5 | STEEL MEASURING TAPE, AVHRR | 1982-06-01 to 2010-09-30 |
N: 90 S: 55.8 E: 180 W: -180 |
multiple | |
| CITE-2 Electra Meteorological and Navigational Data | 1 | NASA ELECTRA | Computer | 1986-08-11 to 1986-09-07 |
N: 44.43 S: 30.55 E: -68.12 W: -131.91 |
GTE | |
| CITE-3 Electra Meteorological and Navigational Data | 1 | NASA ELECTRA | Computer | 1989-08-14 to 1989-10-01 |
N: 40.13 S: 0.01 E: -26.93 W: -81.48 |
GTE | |
| CLAMS Chesapeake Lighthouse Vaisala RS-80 Radiosonde | 1 | OCEAN PLATFORMS | RADIOSONDES | 2001-07-10 to 2001-08-02 | ASCII | ||
| CLAMS CV-580 Cloud Absorption Radiometer (CAR) | 1 | Convair-580 | CAR | 2001-07-10 to 2001-08-02 | HDF4 | ||
| Climate Normals for Last Glacial Maximum and Modern (1975-2005), Alaska | 1 | COMPUTERS | Computer | 1000-01-01 to 2005-12-31 |
N: 74 S: 47.7384 E: -106.933 W: -178.236 |
GeoTIFF | |
| CMS: Evapotranspiration and Meteorology, Water-Limited Shrublands, Mexico, 2008-2010 | 1 | FIXED OBSERVATION STATIONS, METEOROLOGICAL STATIONS | SOIL HEAT FLUX TRANSDUCER, EDDY CORRELATION DEVICES, IRGA, SOIL MOISTURE PROBE, RAIN GAUGES | 2008-01-01 to 2010-12-31 |
N: 32.0301 S: 29.741 E: -110.534 W: -116.605 |
CSV | |
| CMS: Hourly Carbon Dioxide Estimated Using the WRF Model, North America, 2010 | 1 | CLIMATE MODELS | Computer | 2010-01-01 to 2010-12-31 |
N: 63 S: 13 E: -41 W: -151 |
netCDF-4 classic | |
| Collected Data from The Boreal Ecosystem-Atmosphere Study, NASA, CD-ROM | 1 | FIELD SURVEYS, LANDSAT, Airplane, SATELLITES, GOES | HUMIDITY SENSORS, TEMPERATURE SENSORS, PROBES, NETS, SOIL SAMPLER, MSS, TM, CAMERAS, RADIOSONDES, RAWINSONDES, VEGETATION-1, AVHRR | 1993-01-01 to 1997-03-31 |
N: 59.98 S: 50.09 E: -93.5 W: -111 |
Shapefile | |
| CPEX-AW Dropsonde Data | 1 | NASA DC-8 | DROPSONDES | 2021-08-06 to 2021-09-16 | NetCDF-3, ICARTT | ||
| CPEX-AW HALO Aerosol and Water Vapor Profiles and Images | 1 | NASA DC-8 | HALO | 2021-08-20 to 2021-09-04 | HDF5, PNG | ||
| CPEX-CV Dropsonde Data | 1 | NASA DC-8 | DC8 DROPSONDES | 2022-06-16 to 2022-10-03 | NetCDF-4, ICARTT, PNG | ||
| CPEX-CV HALO Aerosol and Water Vapor Profiles and Images | 1 | NASA DC-8 | HALO | 2022-09-03 to 2022-09-30 | HDF5, PNG | ||
| CPEX-CV Merge Data Files | 1 | NASA DC-8, Data Analysis | CIP, CAS, Computer | 2022-09-06 to 2022-10-02 | ICARTT | ||
| Daily SnowModel Outputs Covering the ABoVE Core Domain, 3-km Resolution, 1980-2020 | 1 | MODELS | Computer | 1980-09-01 to 2020-08-31 |
N: 75.8357 S: 49.8038 E: -84.3282 W: -176.915 |
netCDF-4 classic | |
| Daymet: Annual Climate Summaries on a 1-km Grid for North America, Version 4 R1 | 4.1 | MODELS | Computer | 1950-01-01 to 2024-12-31 |
N: 83.7064 S: 6.07616 E: -53.055 W: -178.204 |
multiple | |
| Daymet: Daily Surface Weather Data on a 1-km Grid for North America, Version 4 R1 | 4.1 | MODELS | Computer | 1950-01-01 to 2024-12-31 |
N: 82.9143 S: 14.0749 E: -53.0567 W: -178.133 |
netCDF-4 | |
| Daymet: Monthly Climate Summaries on a 1-km Grid for North America, Version 4 R1 | 4.1 | MODELS | Computer | 1950-01-01 to 2024-12-31 |
N: 82.9143 S: 14.0749 E: -53.0567 W: -178.133 |
COG | |
| Daymet: Station-Level Inputs and Cross-Validation for North America, Version 4 R1 | 4.1 | MODELS | Computer | 1950-01-01 to 2023-12-31 |
N: 82.9143 S: 14.0749 E: -52.6667 W: -178.133 |
multiple |
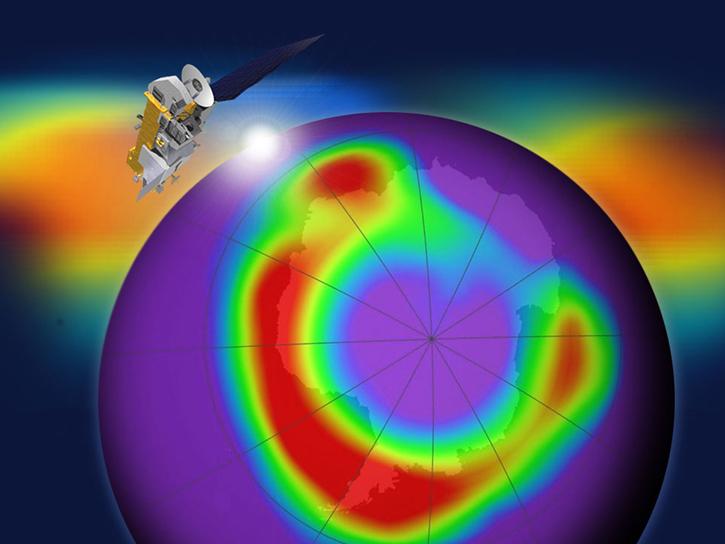
Featured Atmospheric Temperature Observation Method: MLS
The Microwave Limb Sounder (MLS) is radiometer and spectrometer that measures microwave thermal emission from the edge, or "limb," of Earth’s atmosphere. The MLS can measure vertical profiles of the atmosphere including temperature. The instrument acquires data globally day and night and can do so in the presence ice clouds and aerosols that would interfere with measurements from other devices.
In coordination with the Microwave Limb Sounder (MLS) team, we now have several MLS products available through the GIBS image access APIs.
Learn how to visualize Microwave Limb Sounder data through OPeNDAP.
The Microwave Limb Sounder Near-Real Time (MLS NRT) products are provided by the Land, Atmosphere Near-real time Capability for EOS (LANCE).
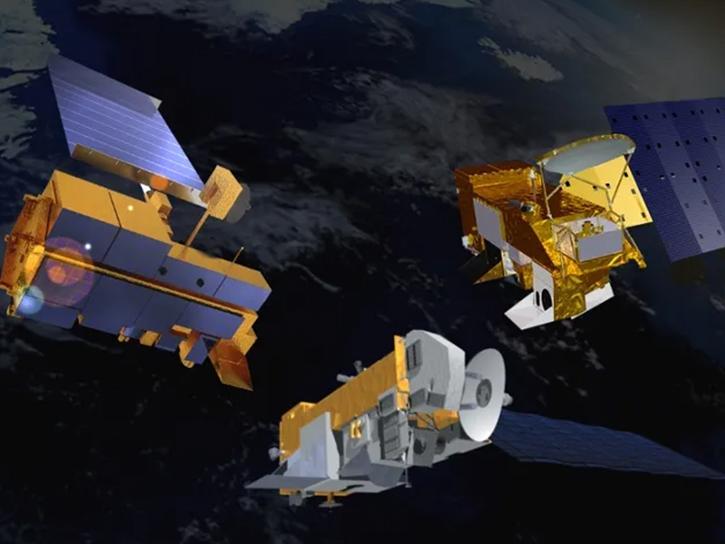
A new Request for Information (RFI) with responses due by April 4 seeks input for determining Terra, Aqua, and Aura mission data product continuity needs, capabilities, and gaps.
Frequently Asked Questions
Earthdata Forum
Our online forum provides a space for users to browse thousands of FAQs about research needs, data, and data applications. You can also submit new questions for our experts to answer.
Submit Questions to Earthdata Forumand View Expert Responses