We are in the process of migrating all NASA Earth science data sites into Earthdata from now until end of 2026. Not all NASA Earth science data and resources will appear here until then. Thank you for your patience as we make this transition.
Read about the Web Unification Project
What are Plankton?
Plankton are marine or aquatic organisms that have little or no ability to swim. They are a diverse group encompassing thousands of species found in nearly every watery environment on Earth. They range in size from microscopic, single-celled organisms to jellyfish and the larval stage of some fish.
Plankton are separated into two main groups — phytoplankton and zooplankton. Phytoplankton use photosynthetic pigments to produce energy like plants, whereas zooplankton consume other tiny organisms for nourishment.
Plankton are the center of marine food webs. Many species depend on them for nourishment, and changes in their populations can ripple outwards to affect everything from fish and shellfish stocks to apex predators like sharks and whales.
How do Scientists Study Plankton?
NASA has been observing the color of the ocean from space since at least 1978, when the Coastal Zone Color Scanner (CZCS) instrument was launched on the Nimbus-7 spacecraft. Paired with in situ sampling missions, CZCS observations presented the first global picture of coastal productivity and turbidity, and illuminated the impact of storms, runoff, and pollution on coastal ecosystems.
Later missions successively looked at ocean color in ever more detail. The Sea-viewing Wide Field-of-view Sensor (SeaWiFS) expanded NASA’s ocean observations, with more spectral bands than CZCS. The Moderate Resolution Imaging Spectroradiometer (MODIS) started observing the world’s oceans in 2000, examining the ratio of blues and greens in the ocean to generate chlorophyll maps. MODIS provides a long-term record of trends in ocean productivity, and this legacy has continued with the Visible Infrared Imaging Radiometer Suite (VIIRS) on several NOAA-NASA satellites.
Launched in 2024, NASA's Plankton, Aerosol, Cloud, ocean Ecosystem (PACE) mission further expanded ocean color observations. PACE's Ocean Color Instrument (OCI) detects visible, infrared, and ultraviolet light across more than 100 bands. Researchers can use machine learning to match these bands with spectral libraries—records of how specific plankton species absorb light across these wavelengths.
How Do Scientists Use Plankton Data?
Studies of plankton can illuminate the dynamics of marine ecosystems. This is vital for marine fisheries management and conservation, as the presence of plankton often attracts and provides food for other species. Blooms of some species of plankton can create toxins or deplete oxygen from the water–known as harmful algal blooms (HABs)–in ways that affect human- and fisheries health.
Plankton research can also help us predict how marine ecosystems may change as oceans become warmer and more acidic. For instance, plankton species may start to migrate to different regions than in the past, so the marine species that depend on them will have to adapt or migrate as well.
NASA provides decades of observations on plankton concentrations and marine productivity from CZCS, MODIS, PACE, and more. NASA Earthdata is also home to a broad catalog of tutorials, webinars, and guides to integrate these data into research workflows.
Learn How to Use Plankton Data
Access a range of webinars, tutorials, data recipes, and data stories to enhance your knowledge of Earth observation data.
Introduction to Plankton, Aerosol, Cloud, Ocean Ecosystem (PACE) Hyperspectral Observations for Water Quality Monitoring
This ARSET training provides an overview of past and current hyperspectral sensors and NASA's PACE mission.
Preparing for PACE Data
Simulated data help Plankton, Aerosol, Cloud, ocean Ecosystem (PACE) users prepare a day in the life of the new satellite.

New PACE Data Tutorials
A series of Jupyter notebook tutorials show how to retrieve and use data from NASA's Plankton, Aerosol, Cloud, ocean Ecosystem (PACE) mission.
Discover the Help Hub for Ocean Color Learning Resources
The Help Hub hosted by NASA's Ocean Biology Distributed Active Archive Center (OB.DAAC) has been updated with new learning resources for processing ocean color satellite data, working with Plankton, Aerosol, Cloud, ocean Ecosystem (PACE) data, and more.
Discover and Visualize Plankton Data
NASA data help us understand Earth's changing systems in more detail than ever before, and visualizations help make Earth science concepts accessible, beautiful, and impactful.
Data visualization is a powerful tool for analysis, trend and pattern recognition, and communication. Our resources help you find data visualizations to complement and enhance your research. We also have tools and tutorials to help you translate plankton data into compelling visuals.
Image

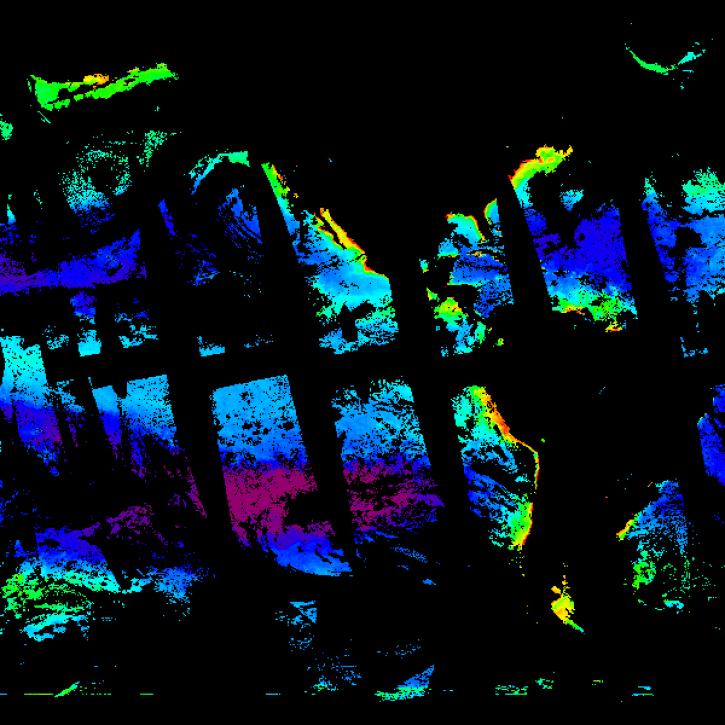
Phytoplankton Bloom in Long Bay, Australia
Base image captured Jan 12, 2024, by the VIIRS instrument aboard the joint NASA/NOAA Suomi NPP satellite, overlaid with Chlorophyll a.
Base image captured Jan 12, 2024, by the VIIRS instrument aboard the joint NASA/NOAA Suomi NPP satellite, overlaid with Chlorophyll a.
Join Our Community of NASA Data Users
While NASA data are openly available without restriction, an Earthdata Login is required to download data and to use some tools with full functionality.
Learn About the Benefits of Earthdata LoginFrequently Asked Questions
Earthdata Forum
Our online forum provides a space for users to browse thousands of FAQs about research needs, data, and data applications. You can also submit new questions for our experts to answer.
Submit Questions to Earthdata Forumand View Expert Responses