From discovery to visualization, data tools such as the SEDAC Hazards Mapper and NASA's Flooding Days Projection Tool guide users in making the most of natural hazards data.
Natural Hazards Data Access and Tools
Natural Hazards Datasets
| Dataset Sort descending | Version | Platform | Instrument | Temporal Extent | Spatial Extent | Spatial Resolution | Data Format |
|---|---|---|---|---|---|---|---|
| U.S. Population Grids (Summary File 1), 2000: Houston Metropolitan Statistical Area, Alpha Version | alpha | MODELS | Computer | 2000-04-01 |
N: 31 S: 28 E: -94 W: -97 |
Grid, PDF, PNG | |
| U.S. Population Grids (Summary File 1), 2000: New Orleans Metropolitan Statistical Area, Alpha Version | alpha | MODELS | Computer | 2000-04-01 |
N: 31 S: 28 E: -88 W: -91 |
Grid, PDF, PNG | |
| U.S. Population Grids (Summary File 3), 2000: Alabama, Louisiana, and Mississippi, Alpha Version | alpha | MODELS | Computer | 2000-04-01 |
N: 36 S: 28 E: -84 W: -95 |
Grid | |
| VIIRS/JPSS1+JPSS2 Global Flood Product L3 NRT 250m 1-day CS GeoTIFF | 2 | NOAA-20, NOAA-21, Suomi-NPP | VIIRS | 2026-03-04 to Present |
N: 90 S: -90 E: 180 W: -180 |
250 Meters x 250 Meters | GeoTIFF |
| VIIRS/JPSS1+JPSS2 Global Flood Product L3 NRT 250m 1-day GeoTIFF | 2 | NOAA-20, NOAA-21, Suomi-NPP | VIIRS | 2026-03-04 to Present |
N: 90 S: -90 E: 180 W: -180 |
250 Meters x 250 Meters | GeoTIFF |
| VIIRS/JPSS1+JPSS2 Global Flood Product L3 NRT 250m 2-day GeoTIFF | 2 | NOAA-20, NOAA-21, Suomi-NPP | VIIRS | 2026-03-04 to Present |
N: 90 S: -90 E: 180 W: -180 |
250 Meters x 250 Meters | GeoTIFF |
| VIIRS/JPSS1+JPSS2 Global Flood Product L3 NRT 250m 3-day GeoTIFF | 2 | NOAA-20, NOAA-21, Suomi-NPP | VIIRS | 2026-03-04 to Present |
N: 90 S: -90 E: 180 W: -180 |
250 Meters x 250 Meters | GeoTIFF |
| VIIRS/NPP Burned Area Monthly L4 Global 500m SIN Grid V001 | 001 | Suomi-NPP | VIIRS | 2014-01-01 to 2019-01-01 |
N: 90 S: -90 E: 180 W: -180 |
500 Meters x 500 Meters | HDF-EOS5 |
| VIIRS/NPP Burned Area Monthly L4 Global 500m SIN Grid V002 | 002 | Suomi-NPP | VIIRS | 2012-03-01 to Present |
N: 90 S: -90 E: 180 W: -180 |
500 Meters x 500 Meters | HDF-EOS5 |
| Yale Center for Earth Observation (YCEO) Surface Urban Heat Islands, Version 4, 2003-2018 | 4.00 | MODELS | Computer | 2003-01-01 to 2018-12-31 |
N: 90 S: -90 E: 180 W: -180 |
GeoTIFF, Shapefile |
Featured Observation Method: VIIRS
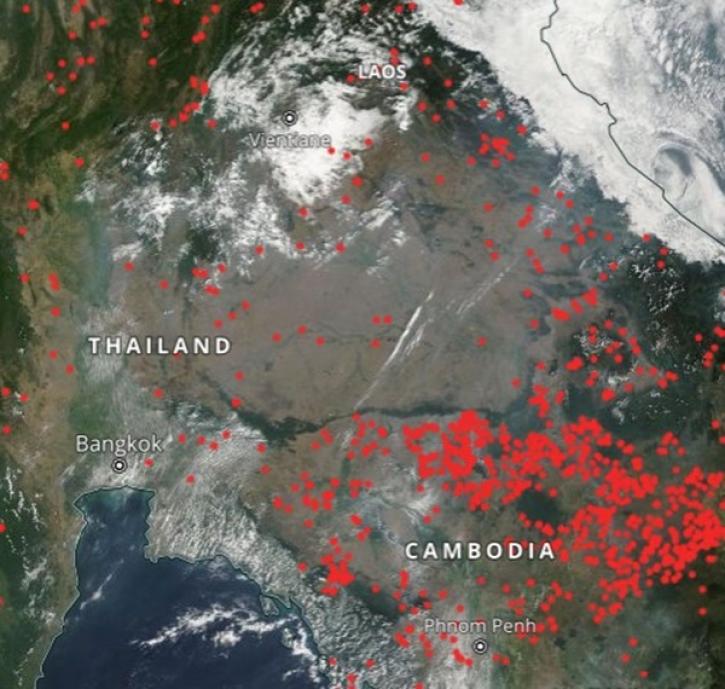
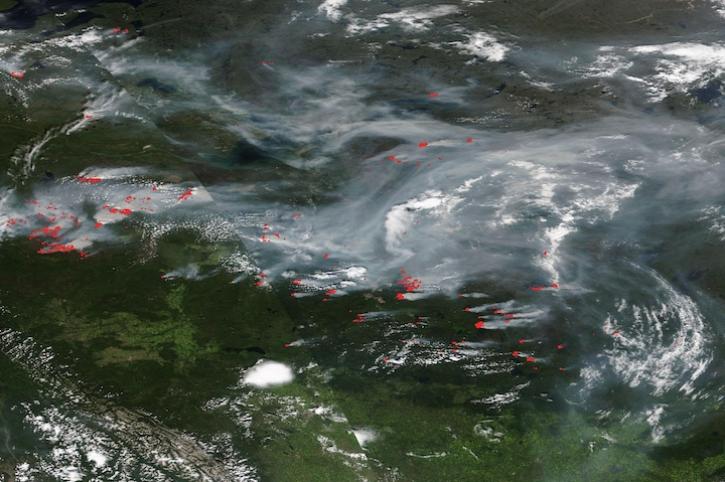
NASA's Visible Infrared Imaging Radiometer Suite (VIIRS) provides active data for fire management and wildfire alert systems.
Natural Hazards Data Tools
| Tool Sort descending | Description | Services | |
|---|---|---|---|
| SOTO | State of the Ocean (SOTO) is an interactive web-based tool that generates informative maps, animations, and plots that communicate and prove the discovery and analysis of the state of the oceans. | Analysis, Search and Discovery, Visualization | |
| TESViS | The Terrestrial Ecology Subsetting & Visualization Services Global Subsets Tool provides on-demand, customized subsets of several terrestrial ecology data products. | Visualization, Subsetting | |
| VEDA | NASA's Visualization, Exploration, and Data Analysis (VEDA) project is an open-source science cyberinfrastructure for data processing, visualization, exploration, and geographic information systems (GIS) capabilities. | Access, Analysis, Processing, Visualization, Geoprocessing | |
| Vertex | Vertex is a graphical search interface for finding synthetic aperture radar (SAR) data. | Search and Discovery, Access, Downloading, Processing, Subsetting |
Pagination
- 1
- 2
Frequently Asked Questions
Earthdata Forum
Our online forum provides a space for users to browse thousands of FAQs about research needs, data, and data applications. You can also submit new questions for our experts to answer.
Submit Questions to Earthdata Forumand View Expert Responses