We are in the process of migrating all NASA Earth science data sites into Earthdata from now until end of 2026. Not all NASA Earth science data and resources will appear here until then. Thank you for your patience as we make this transition.
Read about the Web Unification Project
Sea Surface Temperature Data Access and Tools
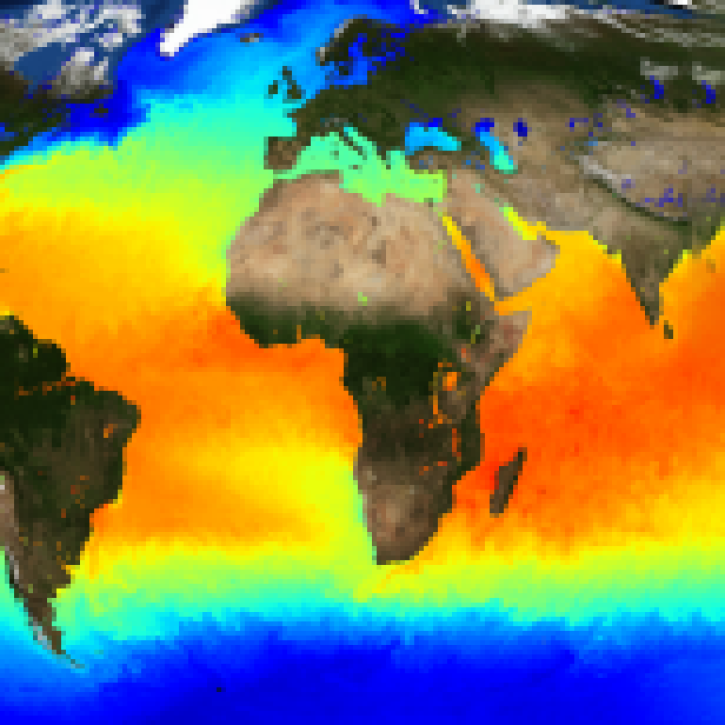
Sea surface temperature data from NASA range from near-real-time retrospective Level 4 datasets to biogeochemical ocean model data. Our datasets and tools help users find and integrate the data they need to learn more about sea surface temperatures and what they mean for weather, climate, and ocean habitats and wildlife.
Sea Surface Temperature Datasets
| Dataset Sort descending | Version | Platform | Instrument | Temporal Extent | Spatial Extent | Spatial Resolution | Data Format |
|---|---|---|---|---|---|---|---|
| MODIS Terra Level 3 SST Thermal IR Daily 9km Nighttime V2019.0 | 2019.0 | Terra | MODIS | 2000-02-24 |
N: 90 S: -90 E: 180 W: -180 |
0.083 Decimal Degrees x 0.083 Decimal Degrees | netCDF-4 |
| MODIS Terra Level 3 SST Thermal IR Monthly 4km Daytime V2019.0 | 2019.0 | Terra | MODIS | 2000-02-24 |
N: 90 S: -90 E: 180 W: -180 |
0.041 Decimal Degrees x 0.041 Decimal Degrees | netCDF-4 |
| MODIS Terra Level 3 SST Thermal IR Monthly 4km Nighttime V2019.0 | 2019.0 | Terra | MODIS | 2000-02-24 |
N: 90 S: -90 E: 180 W: -180 |
0.041 Decimal Degrees x 0.041 Decimal Degrees | netCDF-4 |
| MODIS Terra Level 3 SST Thermal IR Monthly 9km Daytime V2019.0 | 2019.0 | Terra | MODIS | 2000-02-24 |
N: 90 S: -90 E: 180 W: -180 |
0.083 Decimal Degrees x 0.083 Decimal Degrees | netCDF-4 |
| MODIS Terra Level 3 SST Thermal IR Monthly 9km Nighttime V2019.0 | 2019.0 | Terra | MODIS | 2000-02-24 |
N: 90 S: -90 E: 180 W: -180 |
0.083 Decimal Degrees x 0.083 Decimal Degrees | netCDF-4 |
| NAAMES R/V Atlantis Miscellaneous Data, Version 1 | 1 | R/V Atlantis | THERMOSALINOGRAPHS | 2015-01-01 to 2018-09-24 | NetCDF-4, ASCII, ICARTT, GIF, KML, PDF, PNG, JPEG | ||
| NCEP/DOE Reanalysis II, for GSSTF, 0.25 x 0.25 deg, Daily Grid V3 (GSSTF_NCEP) at GES DISC | 3 | NCEP-GFS | NOT APPLICABLE | 1987-07-01 to 2009-01-01 |
N: 90 S: -90 E: 180 W: -180 |
||
| NCEP/DOE Reanalysis II, for GSSTF, 0.25x0.25 deg, Monthly grid V3 (GSSTFM_NCEP) at GES DISC | 3 | NCEP-GFS | NOT APPLICABLE | 1987-07-01 to 2008-12-31 |
N: 90 S: -90 E: 180 W: -180 |
||
| NCEP/DOE Reanalysis II in HDF-EOS5, for GSSTF2c, 1x1 deg Daily grid V2c (GSSTF_NCEP) at GES DISC | 2c | NCEP-GFS | NOT APPLICABLE | 1987-07-01 to 2009-01-01 |
N: 90 S: -90 E: 180 W: -180 |
||
| NCEP/DOE Reanalysis II in HDF-EOS5, for GSSTF2c, 1x1 deg Monthly grid V2c (GSSTFM_NCEP) at GES DISC | 2c | NCEP-GFS | NOT APPLICABLE | 1987-07-01 to 2008-12-31 |
N: 90 S: -90 E: 180 W: -180 |
||
| NOAA GHRSST Level 2P Atlantic Ocean Regional Skin Sea Surface Temperature v1.0 from the Spinning Enhanced Visible and InfraRed Imager (SEVIRI) on the Meteosat Second Generation-4 (MSG-4) satellite | 1.0 | MSG | SEVIRI | 2018-09-10 to 2023-03-21 |
N: 73 S: -73 E: 81 W: -81 |
3000 Meters x 3000 Meters | netCDF-4 |
| NOAA GHRSST Level 2P Indian Ocean Regional Skin Sea Surface Temperature v1.0 from the Spinning Enhanced Visible and InfraRed Imager (SEVIRI) on the Meteosat Second Generation-1 (MSG-1) satellite | 1.0 | MSG | SEVIRI | 2018-09-18 to 2022-06-01 |
N: 73 S: -73 E: 81 W: -81 |
3000 Meters x 3000 Meters | netCDF-4 |
| NOAA GHRSST Level 2P Indian Ocean Regional Skin Sea Surface Temperature v1.0 from the Spinning Enhanced Visible and InfraRed Imager (SEVIRI) on the Meteosat Second Generation-2 (MSG-2) satellite | 1.0 | MSG | SEVIRI | 2013-08-01 |
N: 73 S: -73 E: 81 W: -81 |
3000 Meters x 3000 Meters | netCDF-4 |
| NOAA-20 VIIRS Level-2 Regional 11µm Datime Sea Surface Temperature(SST) - Near Real-time (NRT) Data, version 2024.0 | 2024.0 | NOAA-20 | VIIRS | 2017-11-29 to Present |
N: 90 S: -90 E: 180 W: -180 |
netCDF-4 | |
| NOAA-20 VIIRS Level-2 Regional 11µm Daytime Sea Surface Temperature (SST) Data, version 2024.0 | 2024.0 | NOAA-20 | VIIRS | 2017-11-29 to Present |
N: 90 S: -90 E: 180 W: -180 |
netCDF-4 | |
| NOAA-20 VIIRS Level-3 Global Binned 11µm Datime Sea Surface Temperature(SST) - Near Real-time (NRT) Data, version 2024.0 | 2024.0 | NOAA-20 | VIIRS | 2017-11-29 to Present |
N: 90 S: -90 E: 180 W: -180 |
netCDF-4 | |
| NOAA-20 VIIRS Level-3 Global Binned 11µm Daytime Sea Surface Temperature (SST) Data, version 2024.0 | 2024.0 | NOAA-20 | VIIRS | 2017-11-29 to Present |
N: 90 S: -90 E: 180 W: -180 |
netCDF-4 | |
| NOAA-20 VIIRS Level-3 Global Mapped 11µm Datime Sea Surface Temperature(SST) - Near Real-time (NRT) Data, version 2024.0 | 2024.0 | NOAA-20 | VIIRS | 2017-11-29 to Present |
N: 90 S: -90 E: 180 W: -180 |
netCDF-4 | |
| NOAA-20 VIIRS Level-3 Global Mapped 11µm Daytime Sea Surface Temperature (SST) Data, version 2024.0 | 2024.0 | NOAA-20 | VIIRS | 2017-11-29 to Present |
N: 90 S: -90 E: 180 W: -180 |
netCDF-4 | |
| NRT AMSR2 Unified L2B Global Swath Ocean Products V1 | 1 | GCOM-W1 | AMSR2 | 2020-06-01 |
N: 89 S: -89 E: 180 W: -180 |
netCDF-4 - HDF-EOS5 | |
| OSCAR Global Mapped Eulerian and Lagrangian Oceanography and Ecology Variables Data, version 1 | 1 | MODELS | Computer | 2000-01-01 to 2009-12-31 |
N: 90 S: -90 E: 180 W: -180 |
netCDF-4 | |
| PISTON 2018 Research Vessel (RV) Thompson ship datasets of ocean, atmosphere, and air-sea interaction | 1 | R/V Thompson | SEA-POL, CTD, ADCP, CHAM, SO, ROSR, W-Band Radar, CEILOMETERS, RADIOMETERS, RAWINSONDES, DISDROMETERS, GPS, Hemisphere VS1000, Gill WindMaster Pro, Vaisala HMT330, ORG-815-DA, Vaisala PTB330, NOAA PSL Sea Snake, SBE-21, Riegl LD90-3100VHS-FLP, Eppley PIR, Vaisala HMT337 | 2018-08-18 to 2018-10-13 | netCDF-4, Text File, TAR | ||
| PISTON 2019 Research Vessel (RV) Sally Ride Data | 1 | R/V Sally Ride | CTD, ADCP, SEA-POL, CHAM, SO, ROSR, HSRL, W-Band Radar, CEILOMETERS, RAWINSONDES, DISDROMETERS, LIDAR, GPS, Hemisphere VS1000, Gill WindMaster Pro, Vaisala HMT337, Vaisala HMT330, ORG-815-DA, Vaisala PTB330, NOAA PSL Sea Snake, SBE-21, Riegl LD90-3100VHS-FLP, Eppley PIR | 2019-08-31 to 2019-09-26 | NetCDF-4, TAR, Text File | ||
| QuikSCAT ESDR Level 2 Ancillary Ocean Surface Fields Version 1.1 | 1.1 | MODELS, QUIKSCAT | Computer, SEAWINDS | 2000-06-01 to 2009-11-22 |
N: 90 S: -90 E: 180 W: -180 |
12.5 Kilometers x 12.5 Kilometers | netCDF-4 |
| REGIONAL AIR-SEA INTERACTION (RASI) GAP WIND AND COASTAL UPWELLING EVENTS CLIMATOLOGY GULF OF PANAMA, PANAMA V1 | 1 | RASI | Computer | 1998-01-01 to 2011-12-31 |
N: 9.13 S: 3.13 E: -77.88 W: -81.88 |
netCDF-3 |
Featured Sea Surface Temperature: VIIRS
The Visible Infrared Imaging Radiometer Suite (VIIRS) is aboard the joint NASA/NOAA Suomi National Polar-orbiting Partnership (Suomi NPP) and NOAA-20 platforms. VIIRS collects global visible and infrared imagery and other observations across Earth including over the ocean.
With the eventual retirement of the Terra and Aqua platforms, the Visible Infrared Imaging Radiometer Suite (VIIRS) instruments will take the lead in daily Earth observations.
19 MIN READ
The public release of the NAVO GHRSST Level 4 K10-SST GDS2.0 product provides global daily analyzed SST at a 1-meter reference depth.
The Visible Infrared Imaging Radiometer Suite (VIIRS) will help ensure continuity of Earth observations after the upcoming retirement of the Moderate Resolution Imaging Spectroradiometer (MODIS).
Join us to learn how to discover, subset, access and visualize both MODIS and VIIRS data products using a suite of user-friendly tools developed by NASA's ORNL DAAC.
Frequently Asked Questions
Earthdata Forum
Our online forum provides a space for users to browse thousands of FAQs about research needs, data, and data applications. You can also submit new questions for our experts to answer.
Submit Questions to Earthdata Forumand View Expert Responses