We are in the process of migrating all NASA Earth science data sites into Earthdata from now until end of 2026. Not all NASA Earth science data and resources will appear here until then. Thank you for your patience as we make this transition.
Read about the Web Unification Project
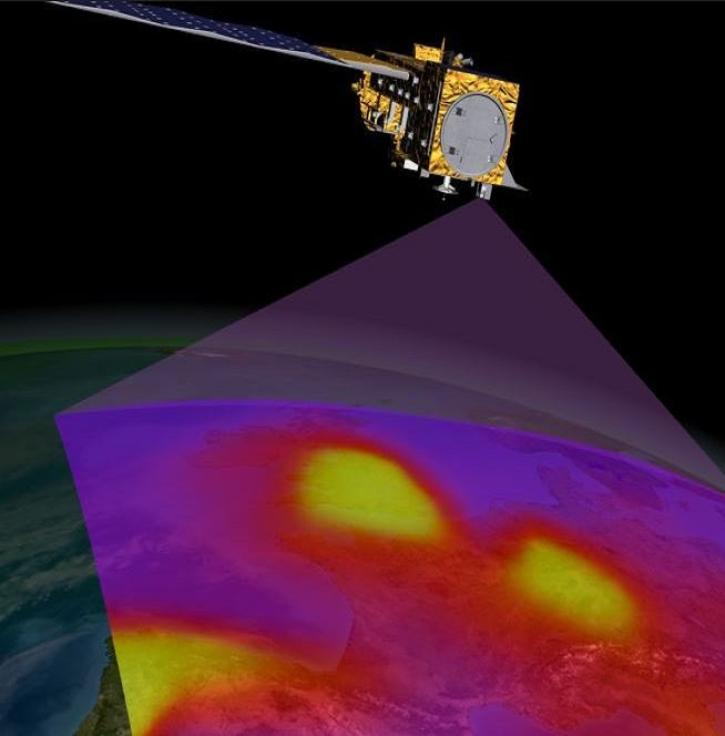
Nitrogen Oxides Data Access and Tools
Access topic-specific data and resources for accessing, visualizing, preparing/manipulating (e.g. subsetting), and analyzing data. Each observation, model, and reanalysis data has unique characteristics that should be considered when evaluating its use.
An asterisk (*) next to an entry indicates that near real-time (NRT) data products are available through NASA's Land, Atmosphere Near real-time Capability for Earth observation (LANCE). While not intended for scientific research, NRT data are good resources for monitoring ongoing or time-critical events. Learn more about the difference between near real-time versus standard products.
Commonly Used Nitrogen Dioxide Data at a Glance
| Spatial Resolution | Spatial Coverage | Temporal Resolution | Temporal Coverage | Spectral Resolution | Satellite/ Platform | Name (Instrument, Model, etc.) | Observation, Model, or Reanalysis | File Format |
|---|---|---|---|---|---|---|---|---|
| 0.25°, 13 km x 24 km | Global | 98 min, Daily | 2004-near present | 1.0-0.45 nm Full Width and Half Maximum (FWHM) | Aura | Ozone Monitoring Instrument (OMI) | Observation | HDF-EOS5 |
| 5.5 km x 3.5 km | Global | 101.5 minutes | 2021-present | 270 nm-2.3 µm, 0.55 nm | ESA Sentinel-5P | TROPOspheric Monitoring Instrument (TROPOMI) | Observation | netCDF |
| 2.0 km x 4.75 km | North America | Hourly | 08/2023 - present | 0.6 nm | Intelsat 40e | Tropospheric Emissions: Monitoring Pollution (TEMPO) | Observation | netCDF |
| 0.25º x 0.25° | Global | 15 min, Hourly | Daily 5-day forecast | N/A | N/A | GEOS-CF | Model | netCDF |
| 0.0083° x 0.0083° | Near-global | Yearly | 1990-2020 | N/A | N/A | LUR | Model | netCDF |
| Point measurements | Global | Periodic flights occurred during each deployment | 2016-2018 | Varies | Airborne Field Campaign | Atmospheric Tomography Mission (ATom) campaign with varying instruments | Observation | netCDF |
Nitrogen Oxides Datasets
| Dataset Sort descending | Version | Platform | Instrument | Temporal Extent | Spatial Extent | Spatial Resolution | Data Format |
|---|---|---|---|---|---|---|---|
| A Global Database of Gas Fluxes from Soils after Rewetting or Thawing, Version 1.0 | 1 | FIELD INVESTIGATION | LICOR SOIL GAS CHAMBER | 1956-01-01 to 2009-12-31 |
N: 74.5 S: -36.45 E: 160.525 W: -149.633 |
CSV | |
| ACCLIP WB-57 Aircraft In-situ Trace Gas Data | 1 | NASA WB-57F | ACOS, COMA, LIF-NO, LIF-SO2, ISAF, COLD 2, UASO3 | 2022-07-14 to 2022-09-14 | ICARTT | ||
| ACCLIP WB-57 Aircraft In-situ Trace Gas Data | 1 | NASA WB-57F | ACOS, COMA, LIF-NO, LIF-SO2, ISAF, COLD 2, UASO3 | 2022-07-14 to 2022-09-14 | ICARTT | ||
| ACCLIP WB-57 Aircraft Merge Data | 1 | NASA WB-57F | Computer | 2022-07-16 to 2022-09-14 |
N: 61.5 S: 16.6 E: 180 W: -180 |
ICARTT | |
| ACCLIP WB-57 Aircraft Merge Data | 1 | NASA WB-57F | Computer | 2022-07-16 to 2022-09-14 |
N: 61.5 S: 16.6 E: 180 W: -180 |
ICARTT | |
| ARCTAS DC-8 Aircraft In-situ Aerosol Trace Gas Data | 1 | NASA DC-8 | ION CHROMATOGRAPHS, GAMMA RAY SPECTROMETERS, ALPHA-SPECTROMETERS | 2008-03-18 to 2008-07-14 | ICARTT | ||
| ARCTAS DC-8 Aircraft In-situ Photolysis Rate Data | 1 | NASA DC-8 | CAFS | 2008-03-17 to 2008-07-14 | ICARTT | ||
| ARCTAS DC-8 Aircraft In-situ Trace Gas Data | 1 | NASA DC-8 | TOGA, GAS CHROMATOGRAPHS, ATHOS, HOxCIMS, TD-LIF, DACOM, DIAL, CIMS, FLUORESCENCE SPECTROSCOPY, NDIR GAS ANALYZER, NOxyO3, PTR-MS | 2008-03-18 to 2008-07-14 | ICARTT | ||
| ARCTAS DC-8 Aircraft Merge Data | 1 | NASA DC-8 | Computer | 2008-03-30 to 2008-07-15 | ICARTT | ||
| ARCTAS Model Data | 1 | CLIMATE MODELS, GEOS-5, GEOS-Chem | Computer | 2008-03-30 to 2008-07-14 | netCDF-3, ICARTT | ||
| ARCTAS P-3B Aircraft Aerosol In-situ Data | 1 | P-3B | PSAP, APS, CPC, RR Neph, AETHALOMETER, DMT SP2, DMA, LDMA, TDMA, OPC, AMS, CCN | 2008-03-25 to 2008-07-13 | ICARTT | ||
| ARCTAS P-3B Aircraft Merge Data | 1 | P-3B | Computer | 2008-03-31 to 2008-07-13 | ICARTT | ||
| ATom: Global Modeling Initiative (GMI) Chemical Transport Model (CTM) Output | 1 | MODELS | Computer | 2016-07-29 to 2018-05-21 |
N: 90 S: -90 E: 180 W: -180 |
netCDF-4 | |
| ATom: L2 In Situ Measurements from NOAA Nitrogen Oxides and Ozone (NOyO3) Instrument | 1 | NASA DC-8 | CHEMILUMINESCENCE | 2016-07-29 to 2018-05-21 |
N: 90 S: -90 E: 180 W: -180 |
ICARTT | |
| ATom: Simulated Data Stream for Modeling ATom-like Measurements | 1 | MODELS | Computer | 1997-08-01 to 2016-08-21 |
N: 59.8 S: -59.8 E: 180 W: 178.9 |
multiple | |
| BDSNP Module for Improved Soil NO Emission Estimates for CMAQ Model, Conterminous USA | 1 | MODELS | Computer | 1950-01-01 to 2016-11-16 |
N: 51.76 S: 22.75 E: -65 W: -129.79 |
netCDF-3 | |
| CAMP2Ex Merge Data Files | 1 | NASA P-3 | Computer | 2019-08-22 to 2019-10-07 | ICARTT, ZIP | ||
| CAMP2Ex Merge Data Files | 1 | NASA P-3 | Computer | 2019-08-22 to 2019-10-07 | ICARTT, ZIP | ||
| CAMP2Ex P-3 In-Situ Trace Gas Data | 1 | NASA P-3 | GAS SENSORS, CRDS | 2019-08-03 to 2019-10-06 | ICARTT | ||
| CITE-2 Electra In-Situ Trace Gas Data | 1 | NASA ELECTRA | GRAB SAMPLERS, GAS CHROMATOGRAPHS, CHEMILUMINESCENCE | 1986-08-11 to 1986-09-07 |
N: 44.43 S: 30.55 E: -68.12 W: -131.91 |
GTE | |
| Country Trends in Major Air Pollutants | 1.00 | MODELS | Computer | 2003-01-01 to 2018-12-31 |
N: 90 S: -90 E: 180 W: -180 |
Excel, PDF, PNG | |
| DC3 In-Situ DC-8 Aircraft Trace Gas Data | 1 | NASA DC-8 | GC-MS, TD-LIF, DACOM, LWCC, CIT-ToF-CIMS, CHEMILUMINESCENCE, PTR-MS, DFGAS, AVOCET | 2012-05-04 to 2012-06-23 | ICARTT | ||
| DC3 In-Situ DC-8 Aircraft Trace Gas Data | 1 | NASA DC-8 | GC-MS, TD-LIF, DACOM, LWCC, CIT-ToF-CIMS, CHEMILUMINESCENCE, PTR-MS, DFGAS, AVOCET | 2012-05-04 to 2012-06-23 | ICARTT | ||
| DC3 In-Situ DLR-Falcon Trace Gas Data | 1 | DLR-Falcon | CIT-ToF-CIMS, CRDS, GAS SENSORS, CHEMILUMINESCENCE, OZONE SENSOR, GAS CHROMATOGRAPHS | 2012-05-29 to 2012-06-18 | ICARTT | ||
| DC3 In-Situ DLR-Falcon Trace Gas Data | 1 | DLR-Falcon | CIT-ToF-CIMS, CRDS, GAS SENSORS, CHEMILUMINESCENCE, OZONE SENSOR, GAS CHROMATOGRAPHS | 2012-05-29 to 2012-06-18 | ICARTT |
Featured Nitrogen Oxides Observation Method: TROPOMI
The Tropospheric Monitoring Instrument (TROPOMI) is the single payload aboard ESA's Sentinel-5P spacecraft, providing daily measurements of cloud height and cover, aerosols, and trace gases such as nitrogen oxides.

Data from the next-generation Instruments will help atmospheric scientists advance air quality measurements and standards.
20 MIN READ
Access NASA Earth observation data within three hours of a satellite observation through the Land, Atmosphere Near real-time Capability for Earth observation (LANCE).

NASA offers an array of carbon monoxide data to aid in determining its role in atmospheric processes, pollution, and climate.
Frequently Asked Questions
Earthdata Forum
Our online forum provides a space for users to browse thousands of FAQs about research needs, data, and data applications. You can also submit new questions for our experts to answer.
Submit Questions to Earthdata Forumand View Expert Responses