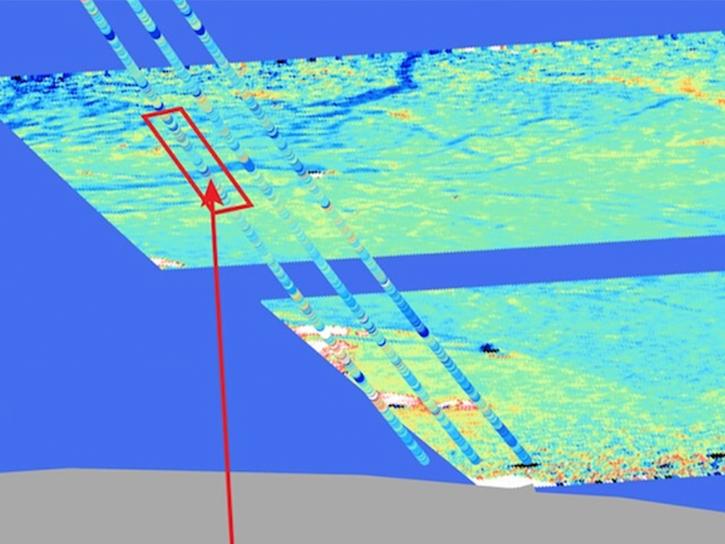
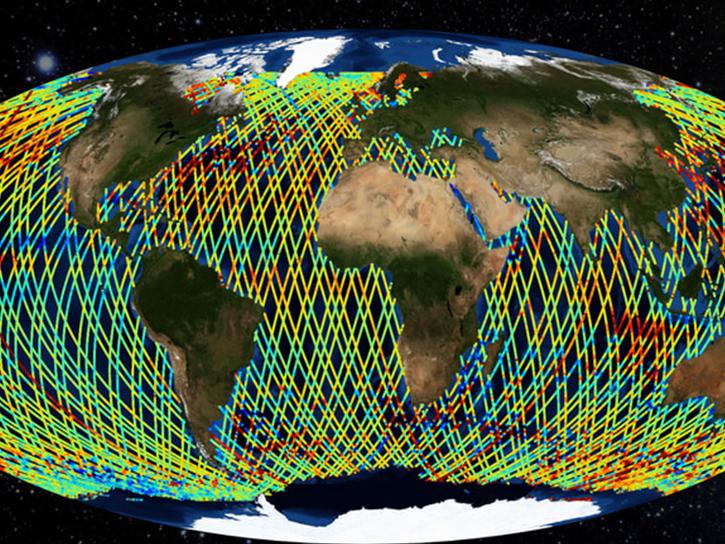
NASA data span the geophysical parameters that characterize the global ocean and the physical processes operating within its depths and at its surface. Our datasets and tools help researchers translate these interconnected data points into actionable knowledge.
Ocean Data Access and Tools
Ocean Datasets
| Dataset Sort descending | Version | Platform | Instrument | Temporal Extent | Spatial Extent | Spatial Resolution | Data Format |
|---|---|---|---|---|---|---|---|
| SPURS-2 research vessel Underway Salinity Profiling System (USPS) data for the E. Tropical Pacific R/V Revelle cruises | 1.0 | R/V Revelle | USPS, THERMOSALINOGRAPHS | 2016-08-15 to 2017-11-15 |
N: 25.84 S: 5.06 E: -119.5 W: -157 |
1 Meters x 1 Meters | netCDF-4 |
| SPURS-2 Saildrone data for the E. Tropical Pacific field campaign | 1.0 | Saildrone | PYROMETERS, ADCP, CTD, FLUOROMETERS, ANEMOMETERS, BAROMETERS | 2017-10-16 to 2017-11-17 |
N: 10.9 S: 8.5 E: -124.5 W: -125 |
1 Meters x 1 Meters | netCDF-4 |
| SPURS-2 Seaglider data for the E. Tropical Pacific field campaign | 1.0 | SEAGLIDER | CTD | 2016-08-24 to 2017-11-07 |
N: 12.022 S: 8.994 E: -122.128 W: -126.122 |
1 Meters x 1 Meters | netCDF-4 |
| SPURS-2 shipboard Acoustic Doppler Current Profiler data for E. Tropical Pacific R/V Revelle cruises | 1.0 | R/V Revelle | ADCP | 2016-08-14 to 2017-11-17 |
N: 21.26 S: 5.06 E: -118.32 W: -157.88 |
1 Meters x 1 Meters | netCDF-4 |
| SPURS-2 shipboard disdrometer data for the E. Tropical Pacific field campaign | 1.0 | Ships | RADAR | 2016-08-11 to 2017-11-17 |
N: 24.204 S: 5.055 E: -119.886 W: -144.783 |
1 Meters x 1 Meters | netCDF-4 |
| SPURS-2 shipboard X-band radar backscatter data for the E. Tropical Pacific field campaign | 1.0 | Ships | RADAR | 2017-10-21 to 2017-11-13 |
N: 10.355 S: 8.927 E: -122.151 W: -129.131 |
1 Meters x 1 Meters | netCDF-4 |
| SPURS-2 shipboard X-band radar backscatter images for the 2016 E. Tropical Pacific field campaign | 1.0 | Ships | RADAR | 2016-08-31 to 2016-09-22 |
N: 10.355 S: 8.927 E: -122.151 W: -129.131 |
1 Meters x 1 Meters | png |
| SPURS-2 Surface Salinity Snake data for the E. Tropical Pacific field campaign R/V Revelle cruises | 1.0 | R/V Revelle | SS | 2016-08-16 to 2017-11-16 |
N: 32.3 S: 5.06 E: -117.3 W: -155.8 |
1 Meters x 1 Meters | netCDF-4 |
| SPURS-2 S/V Lady Amber underway Thermosalinograph and Sea Snake data for the E. Tropical Pacific field campaign | 1.0 | S/V Lady Amber | CTD | 2016-08-29 to 2018-04-30 |
N: 35.627 S: 0.085 E: -126.978 W: -163.925 |
1 Meters x 1 Meters | netCDF-4 |
| SPURS-2 Towed surface salinity profile (SSP) data for the E. Tropical Pacific R/V Revelle cruises | 1.0 | SEAGLIDER | CTD | 2016-08-27 to 2017-11-11 |
N: 16.502 S: 6.546 E: -123.203 W: -140.969 |
1 Meters x 1 Meters | netCDF-4 |
| SPURS-2 underway surface pCO2, DIC and pH data for the E. Tropical Pacific field campaign R/V Revelle cruises | 1.0 | R/V Revelle | SS, THERMOSALINOGRAPHS | 2017-10-21 to 2017-11-13 |
N: 16.411 S: 1.383 E: -121.545 W: -125.572 |
1 Meters x 1 Meters | netCDF-4 |
| SPURS-2 Waveglider data for the E. Tropical Pacific field campaign | 1.0 | Waveglider | CTD, MMS, CURRENT METERS | 2016-08-24 to 2017-11-10 |
N: 13.8 S: 6.1 E: -108.8 W: -126.4 |
1 Meters x 1 Meters | netCDF-4 |
| STEP ER-2 Aircraft In-Situ Radionuclide Data | 1 | NASA ER-2 | NOT APPLICABLE | 1987-01-08 to 1987-02-21 |
N: 37.72 S: -30.11 E: 180 W: -180 |
STEP87 | |
| STS-59_GRD | 1 | STS-59 | SIR-C | 1994-04-09 to 1994-04-22 | |||
| STS-59_METADATA_GRD | 1 | STS-59 | SIR-C | 1994-04-09 to 1994-04-22 | |||
| STS-59_METADATA_SLC | 1 | STS-59 | SIR-C | 1994-04-09 to 1994-04-22 | |||
| STS-59_SLC | 1 | STS-59 | SIR-C | 1994-04-09 to 1994-04-22 | |||
| STS-68_GRD | 1 | STS-68 | SIR-C | 1994-09-30 to 1994-10-12 | |||
| STS-68_METADATA_GRD | 1 | STS-68 | SIR-C | 1994-09-30 to 1994-10-12 | |||
| STS-68_METADATA_SLC | 1 | STS-68 | SIR-C | 1994-09-30 to 1994-10-12 | |||
| STS-68_SLC | 1 | STS-68 | SIR-C | 1994-09-30 to 1994-10-12 | |||
| Studies of Ecological and Chemical Responses to Environmental Trends (SECRET) | 0 | BUOYS, MOORINGS, Water-based Platforms, AUVS, ROVS, Ships | 1998-08-02 to Present |
N: 90 S: -90 E: 180 W: -180 |
|||
| Submersed Aquatic Vegetation (SAV) over Buttermilk and Plymouth Bays, Massachusetts | 0 | BUOYS, MOORINGS, Water-based Platforms, AUVS, ROVS, Ships | 2010-09-15 to Present |
N: 90 S: -90 E: 180 W: -180 |
|||
| Suomi-NPP VIIRS Level-1A Data, version 2 | 2 | Suomi-NPP | VIIRS | 2012-01-02 to Present |
N: 90 S: -90 E: 180 W: -180 |
netCDF-4 | |
| Suomi-NPP VIIRS Level-2 Regional 11µm Datime Sea Surface Temperature(SST) - Near Real-time (NRT) Data, version 2016.2 | 2016.2 | SUOMI-NPP | VIIRS | 2012-01-02 to Present |
N: 90 S: -90 E: 180 W: -180 |
netCDF-4 |
Surface Water and Ocean Topography (SWOT) Platform
SWOT provides detailed surface topography and monitors water body changes over time. The platform enables high-resolution ocean monitoring at 15-150 km spatial scales, tracking ocean currents, coastal dynamics, storm surges, and regional sea level changes. On land, SWOT measures water storage changes in lakes, reservoirs, rivers, and wetlands, supporting river discharge estimates for water resource assessment.
Ocean Data Tools
| Tool Sort descending | Description | Services | |
|---|---|---|---|
| SOTO | State of the Ocean (SOTO) is an interactive web-based tool that generates informative maps, animations, and plots that communicate and prove the discovery and analysis of the state of the oceans. | Analysis, Search and Discovery, Visualization | |
| STREAM | STREAM is a rapid water quality monitoring tool that processes satellite imagery to create maps showing chlorophyll-a, Total Suspended Solids, and water clarity at 20-30 meter resolution. | Processing | |
| SWOT Swath Visualizer | The Surface Water and Ocean Topography (SWOT) Swath Visualizer provides a visualization of two instruments’ coverage of Earth's surface: the Ka-band Radar Interferometer and altimeter. | Analysis, Data Curation, Visualization | |
| Worldview | Worldview offers the capability to interactively browse over 1,200 global, full-resolution satellite imagery layers and download the underlying data. | Analysis, Search and Discovery, Visualization, Access, Comparison, Monitoring Natural Events |
Pagination
- 1
- 2
Frequently Asked Questions
Earthdata Forum
Our online forum provides a space for users to browse thousands of FAQs about research needs, data, and data applications. You can also submit new questions for our experts to answer.
Submit Questions to Earthdata Forumand View Expert Responses