We are in the process of migrating all NASA Earth science data sites into Earthdata from now until end of 2026. Not all NASA Earth science data and resources will appear here until then. Thank you for your patience as we make this transition.
Read about the Web Unification Project
Floods Data Access and Tools
From discovery to visualization, data tools such as the Dartmouth Flood Observatory (DFO), HYDrologic Remote Sensing Analysis for Floods (HYDRAFloods), and the Spatial Data Access Tool (SDAT) guide users in making the most of flood data.
Floods Datasets
| Dataset Sort descending | Version | Platform | Instrument | Temporal Extent | Spatial Extent | Spatial Resolution | Data Format |
|---|---|---|---|---|---|---|---|
| ABoVE: Fractional Open Water Cover for Pan-Arctic and ABoVE-Domain Regions, 2002-2015 | 1 | Aqua, GCOM-W1, Terra | AMSR-E, MODIS, AMSR2 | 2002-06-20 to 2015-12-31 |
N: 90 S: 39.383 E: 180 W: -180 |
GeoTIFF | |
| Geocoded Disasters (GDIS) Dataset | 1.00 | MODELS | Computer | 1960-01-01 to 2018-12-31 |
N: 90 S: -58 E: 180 W: -180 |
CSV, Geodatabase, GeoPackage, RData, PDF, PDF, PNG | |
| Global Flood Hazard Frequency and Distribution | 1.0 | MODELS | Computer | 1985-01-01 to 2003-12-31 |
N: 85 S: -58 E: 180 W: -180 |
0.0417 Decimal Degrees x 0.0417 Decimal Degrees | ASCII, PDF, PNG, WMS |
| Global Flood Mortality Risks and Distribution | 1.0 | MODELS | Computer | 2000-01-01 to 2000-12-31 |
N: 85 S: -58 E: 180 W: -180 |
0.0417 Decimal Degrees x 0.0417 Decimal Degrees | ASCII, DBF, PDF, PNG, WMS |
| Global Flood Proportional Economic Loss Risk Deciles | 1.0 | MODELS | Computer | 2000-01-01 to 2000-12-31 |
N: 85 S: -58 E: 180 W: -180 |
0.0417 Decimal Degrees x 0.0417 Decimal Degrees | ASCII, PDF, PNG, WMS |
| Global Flood Total Economic Loss Risk Deciles | 1.0 | MODELS | Computer | 2000-01-01 to 2000-12-31 |
N: 86 S: -58 E: 180 W: -180 |
0.0417 Decimal Degrees x 0.0417 Decimal Degrees | ASCII, DBF, PDF, PNG, WMS |
| Global Multihazard Frequency and Distribution | 1.0 | MODELS | Computer | 2000-01-01 to 2000-12-31 |
N: 85 S: -58 E: 180 W: -180 |
0.0417 Decimal Degrees x 0.0417 Decimal Degrees | ASCII, DBF, PDF, PNG |
| Global Multihazard Mortality Risks and Distribution | 1.0 | MODELS | Computer | 2000-01-01 to 2000-12-31 |
N: 85 S: -58 E: 180 W: -180 |
0.0417 Decimal Degrees x 0.0417 Decimal Degrees | ASCII, DBF, PDF, PNG |
| Global Multihazard Proportional Economic Loss Risk Deciles | 1.0 | MODELS | Computer | 2000-01-01 to 2000-12-31 |
N: 85 S: -58 E: 180 W: -180 |
0.0417 Decimal Degrees x 0.0417 Decimal Degrees | ASCII, DBF, PDF, PNG |
| Global Multihazard Total Economic Loss Risk Deciles | 1.0 | MODELS | Computer | 2000-01-01 to 2000-12-31 |
N: 85 S: -58 E: 180 W: -180 |
0.0417 Decimal Degrees x 0.0417 Decimal Degrees | ASCII, DBF, PDF, PNG |
| GPM Ground Validation Global Flood Monitoring System (GFMS) Flood Maps IFloodS V1 | 1 | DMSP, Aqua, TRMM, NOAA POES | SSM/I, SSMIS, AMSR-E, TMI, AMSU-B | 2013-03-26 to 2013-06-30 |
N: 49.875 S: -49.875 E: 179.875 W: -179.875 |
netCDF-4, ASCII | |
| High Mountain Asia 30m and 8m Flood Geomorphic Potential V001 | 1 | MODELS | NOT APPLICABLE | 2021-04-22 to 2021-04-22 |
N: 49.7 S: 9.5 E: 121.6 W: 58.1 |
30 Meters x 30 Meters 8 Meters x 8 Meters |
GeoTIFF, Shapefile |
| Land Surface Atmospheric Boundary Interaction Product L3 V1(LANDMET) at GES DISC | 1 | LANDMET | NOT APPLICABLE | 1998-01-01 to 2007-12-31 |
N: 90 S: -90 E: 180 W: -180 |
1 Kilometers x 1 Kilometers | |
| LBA-ECO LC-07 Monthly Inundated Areas, Amazon, Orinoco and Pantanal Basins: 1978-1987 | 1 | Nimbus-7 | SMMR | 1978-12-01 to 1987-08-31 |
N: 10 S: -21 E: -35 W: -80 |
multiple | |
| LBA-ECO LC-07 Monthly Mean Flooded Wetlands Habitat, Central Amazon Basin: 1979-1996 | 1 | JERS-1, Nimbus-7 | SAR, SMMR | 1979-01-01 to 1996-06-30 |
N: 0 S: -8 E: -54 W: -72 |
CSV | |
| MODIS/Aqua+Terra Global Flood Product L3 NRT 250m | 6.1 | Terra, AQUA | MODIS | 2021-03-01 to Present |
N: 90 S: -90 E: 180 W: -180 |
250 Meters x 250 Meters | HDF-EOS |
| MODIS/Aqua+Terra Global Flood Product L3 NRT 250m 1-day CS GeoTIFF | 6.1 | Terra, AQUA | MODIS | 2021-03-15 to Present |
N: 90 S: -90 E: 180 W: -180 |
250 Meters x 250 Meters | GeoTIFF |
| MODIS/Aqua+Terra Global Flood Product L3 NRT 250m 1-day GeoTIFF | 6.1 | Terra, AQUA | MODIS | 2021-03-15 to Present |
N: 90 S: -90 E: 180 W: -180 |
250 Meters x 250 Meters | GeoTIFF |
| MODIS/Aqua+Terra Global Flood Product L3 NRT 250m 2-day GeoTIFF | 6.1 | Terra, AQUA | MODIS | 2021-03-15 to Present |
N: 90 S: -90 E: 180 W: -180 |
250 Meters x 250 Meters | GeoTIFF |
| MODIS/Aqua+Terra Global Flood Product L3 NRT 250m 3-day GeoTIFF | 6.1 | Terra, AQUA | MODIS | 2021-03-15 to Present |
N: 90 S: -90 E: 180 W: -180 |
250 Meters x 250 Meters | GeoTIFF |
| NCA-LDAS Noah-3.3 Land Surface Model L4 Daily 0.125 x 0.125 degree V2.0 (NCALDAS_NOAH0125_D) at GES DISC | 2.0 | Noah-LSM | NOT APPLICABLE | 1979-01-02 to 2016-12-31 |
N: 53 S: 25 E: -67 W: -125 |
0.125 Decimal Degrees x 0.125 Decimal Degrees | |
| U.S. Climate Risk Projections by County, 2040-2049 | 1.00 | MODELS | Computer | 2040-01-01 to 2049-12-31 |
N: 72 S: 17 E: -65 W: -180 |
Shapefile, PDF, PNG, Excel | |
| VIIRS/JPSS1+JPSS2 Daily L3 Global Flood Composite 250m Linear Lat Lon Grid - NRT | 2 | NOAA-20, NOAA-21, Suomi-NPP | VIIRS | 2025-04-15 to Present |
N: 90 S: -90 E: 180 W: -180 |
250 Meters x 250 Meters | HDF5 |
| VIIRS/JPSS1+JPSS2 Global Flood Product L3 NRT 250m 1-day CS GeoTIFF | 2 | NOAA-20, NOAA-21, Suomi-NPP | VIIRS | 2026-03-04 to Present |
N: 90 S: -90 E: 180 W: -180 |
250 Meters x 250 Meters | GeoTIFF |
| VIIRS/JPSS1+JPSS2 Global Flood Product L3 NRT 250m 1-day GeoTIFF | 2 | NOAA-20, NOAA-21, Suomi-NPP | VIIRS | 2026-03-04 to Present |
N: 90 S: -90 E: 180 W: -180 |
250 Meters x 250 Meters | GeoTIFF |
Featured Floods Observation Method: Sentinel-1 C-SAR
The Synthetic Aperture Radar (SAR) aboard the ESA (European Space Agency's) Sentinel-1A/B satellites provides continuous all-weather, day-and-night land imagery. SAR images can be used to see through clouds and vegetation to identify flooded areas caused by seasonal changes, storms, and other events.
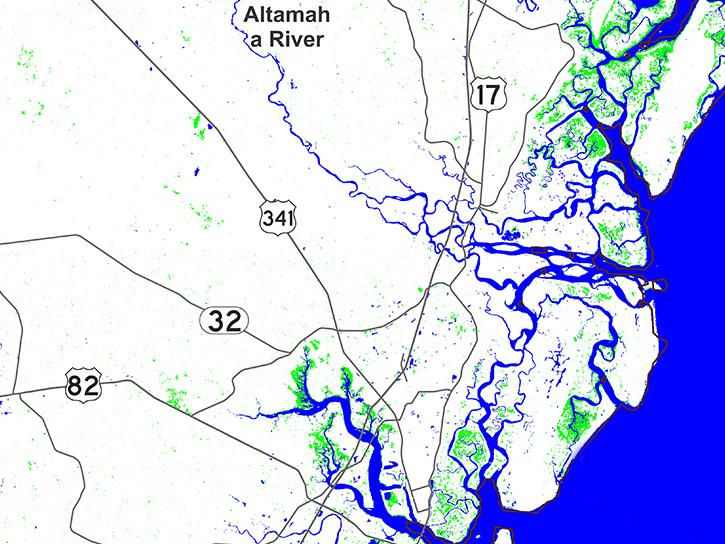
Sentinel-1 synthetic aperture radar (SAR) data are used to create maps of surface water extent for research, planning, and disaster response.
The Observational Products for End-Users from Remote Sensing Analysis (OPERA) Dynamic Surface Water eXtent (DSWx) product suite, a Satellite Needs Working Group solution, maps spatial extent of surface water.
Frequently Asked Questions
Earthdata Forum
Our online forum provides a space for users to browse thousands of FAQs about research needs, data, and data applications. You can also submit new questions for our experts to answer.
Submit Questions to Earthdata Forumand View Expert Responses