We are in the process of migrating all NASA Earth science data sites into Earthdata from now until end of 2026. Not all NASA Earth science data and resources will appear here until then. Thank you for your patience as we make this transition.
Read about the Web Unification Project
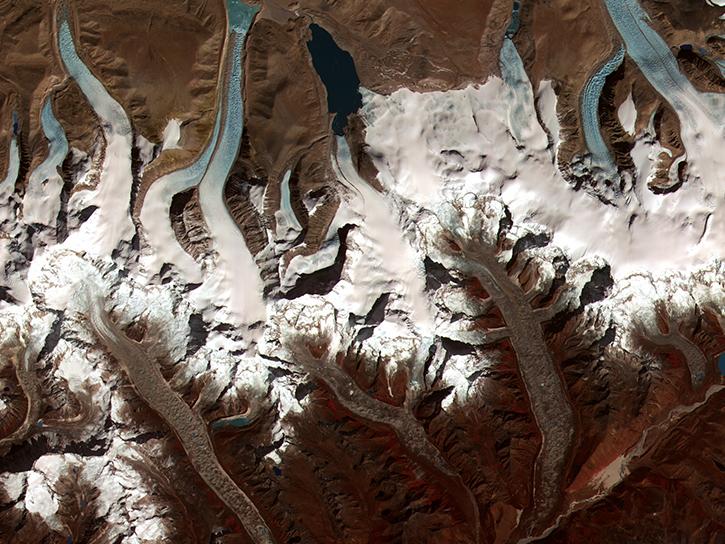
Glaciers/Ice Sheets Data Access and Tools
Glaciers and ice sheets data from NASA range from frequently updated high-resolution instrument imagery to radar altimeter measurements. Our datasets and tools help users find and integrate the data they need to measure the location, size, and other characteristics of glaciers and ice sheets.
Glaciers/Ice Sheets Datasets
| Dataset Sort descending | Version | Platform | Instrument | Temporal Extent | Spatial Extent | Spatial Resolution | Data Format |
|---|---|---|---|---|---|---|---|
| Global PyGEM-OGGM Glacier Projections with RCP and SSP Scenarios V001 | 1 | MODELS | NOT APPLICABLE | 2000-01-01 to 2100-12-31 |
N: 90 S: -90 E: 180 W: -180 |
netCDF-4 | |
| Global Sentinel-1 Burst ID Map | 1 | Sentinel-1A, Sentinel-1B | C-SAR | 2022-05-30 |
N: 90 S: -90 E: 180 W: -180 |
||
| High Mountain Asia 2 m DEM, Surface Velocity, and Lagrangian Surface Mass Balance for Select Debris Covered Glaciers V001 | 1 | GEOEYE-1, WORLDVIEW-1, WORLDVIEW-2, WORLDVIEW-3 | GIS, WV60, WV110 | 2012-12-23 to 2017-12-22 |
N: 28.39 S: 28.2 E: 85.77 W: 85.51 N: 28.12 S: 27.85 E: 87 W: 86.64 |
2 Meters x 2 Meters | GeoTIFF |
| High Mountain Asia Average Glacier Thickness Change from Multi-Sensor DEMs V001 | 1 | HEXAGON KH-9, Terra | CAMERA, ASTER | 1974-01-01 to 2017-12-31 |
N: 34.4 S: 27.4 E: 92.9 W: 75.4 |
30 Meters x 30 Meters | Shapefile, KML |
| High Mountain Asia Glacier Thickness Change Mosaics from Multi-Sensor DEMs V001 | 1 | HEXAGON KH-9, Terra | CAMERA, ASTER | 1974-01-01 to 2017-12-31 |
N: 34.4 S: 27.4 E: 92.9 W: 75.4 |
30 Meters x 30 Meters | PNG, GeoTIFF |
| High Mountain Asia Gridded Glacier Thickness Change from Multi-Sensor DEMs V001 | 1 | HEXAGON KH-9, Terra | CAMERA, ASTER | 1974-01-01 to 2017-12-31 |
N: 34.4 S: 27.4 E: 92.9 W: 75.4 |
30 Meters x 30 Meters | netCDF-4, GeoTIFF |
| High Mountain Asia Near-Global Multi-Decadal Glacial Lake Inventory V001 | 1 | LANDSAT-4, LANDSAT-5, LANDSAT-7, LANDSAT-8 | MSS, TM, ETM+, OLI, TIRS | 1990-01-01 to 2018-12-31 |
N: 82.6 S: -55.4 E: 180 W: -180 |
30 Meters x 30 Meters | Shapefile |
| High Mountain Asia PyGEM Glacier Projections with RCP Scenarios V001 | 1 | MODELS | NOT APPLICABLE | 2000-10-01 to 2100-09-30 |
N: 45 S: 25 E: 105 W: 65 |
netCDF-4 | |
| High Mountain Asia Rasterized PyGEM Glacier Projections with RCP Scenarios V001 | 1 | MODELS | NOT APPLICABLE | 2000-10-01 to 2100-10-15 |
N: 51.8 S: 7.4 E: 135.1 W: 56.5 |
netCDF-4, GeoTIFF | |
| High Mountain Asia Supraglacial Lake Extents on Debris Covered Glaciers, 1988-2023 V001 | 1 | LANDSAT-5, LANDSAT-7, LANDSAT-8, LANDSAT-9 | MSS, ETM+, OLI, OLI-2 | 1988-01-01 to 2023-12-31 |
N: 42.45 S: 22.57 E: 101.99 W: 70.03 |
30 Meters x 30 Meters | Shapefile |
| IceBridge Accumulation Radar L1B Geolocated Radar Echo Strength Profiles V002 | 2 | DC-8, P-3B | Accumulation Radar | 2013-03-21 to 2018-05-01 |
N: 90 S: 60 E: 180 W: -180 N: -53 S: -90 E: 180 W: -180 |
netCDF-4, XML, JPEG | |
| IceBridge ATM L1B Elevation and Return Strength with Waveforms V001 | 1 | C-130, DC-8, G-V, HU-25A, HU-25C, P-3B, WP-3D ORION | ATM | 2017-07-17 to 2019-11-20 |
N: 90 S: 60 E: 180 W: -180 N: -53 S: -90 E: 180 W: -180 |
HDF5 | |
| IceBridge ATM L1B Qfit Elevation and Return Strength V001 | 1 | AIRCRAFT, DC-8, P-3B | ATM | 2009-03-31 to 2012-11-08 |
N: 90 S: 60 E: 180 W: -180 N: -53 S: -90 E: 180 W: -180 |
Binary | |
| IceBridge ATM Waveform Derived Snow Effective Grain Radius V001 | 1 | NASA DC-8, NASA P-3 | ATM | 2017-07-17 to 2019-09-11 |
N: 90 S: 60 E: 180 W: -180 |
0.5 Meters x 0.5 Meters | netCDF-4 |
| IceBridge DMS L3 Ames Stereo Pipeline Photogrammetric DEM V001 | 1 | B-200, BT-67, C-130, DC-8, DHC-3, G-V, HU-25A, HU-25C, P-3B, WP-3D ORION | DMS | 2009-10-16 to 2017-07-25 |
N: 90 S: 60 E: 180 W: -180 N: -53 S: -90 E: 180 W: -180 |
GeoTIFF | |
| IceBridge HiCARS 1 L2 Geolocated Ice Thickness V001 | 1 | BT-67, DHC-6 | HiCARS1 | 2009-01-02 to 2010-12-21 |
N: -53 S: -90 E: 180 W: -180 |
XML, ASCII | |
| IceBridge MCoRDS L2 Ice Thickness V001 | 1 | BT-67, C-130, DC-8, G-V, NASA DC-8, NOAA Twin Otter, P-3B, WP-3D ORION | MCoRDS | 2009-10-16 to 2019-11-20 |
N: -57 S: -90 E: 180 W: -180 N: 83.1 S: 59 E: 28.5 W: -100.2 |
CSV | |
| IceBridge MCoRDS L3 Gridded Ice Thickness, Surface, and Bottom V002 | 2 | AIRCRAFT, DC-8, P-3B | RADAR ECHO SOUNDERS, ATM, MCoRDS | 2006-01-01 to 2012-12-31 |
N: -53 S: -90 E: 180 W: -180 N: 90 S: 60 E: 180 W: -180 |
PNG, ASCII, Shapefile, MAT, CSV | |
| IceBridge Merged Photon Counting Lidar/Profiler L4 Surface Slope and Elevations V001 | 1 | BT-67 | Sigma Space Lidar | 2010-11-25 to 2012-12-04 |
N: -53 S: -90 E: 180 W: -180 |
10 Meters x 10 Meters | HDF5 |
| IceBridge Photon Counting Lidar L1B Subset Geolocated Photon Elevations V001 | 1 | BT-67 | Sigma Space Lidar | 2010-11-25 to 2012-12-11 |
N: -53 S: -90 E: 180 W: -180 |
HDF5 | |
| IceBridge Photon Counting Lidar L1B Unclassified Geolocated Photon Elevations V001 | 1 | BT-67 | Sigma Space Lidar | 2011-11-29 to 2011-12-23 |
N: -53 S: -90 E: 180 W: -180 |
HDF5 | |
| IceBridge Snow Radar L1B Geolocated Radar Echo Strength Profiles V002 | 2 | C-130, DC-8, DHC-3, G-V, P-3B, WP-3D ORION | SNOW RADAR | 2009-03-31 to 2021-05-13 |
N: -53 S: -90 E: 180 W: -180 N: 90 S: 60 E: 180 W: -180 |
netCDF-4, XML, JPEG | |
| IceBridge UAF Lidar Profiler L1B Geolocated Surface Elevation Triplets V001 | 1 | DHC-3 | UAF Profiler | 2009-05-22 to 2009-06-02 |
N: 59.3 S: 56.94611 E: -132.32944 W: -137.52667 |
LAS | |
| IceBridge UAF Lidar Scanner L1B Geolocated Surface Elevation Triplets V001 | 1 | BT-67, DHC-3 | UAF Scanner | 2009-08-19 to 2020-06-05 |
N: -53 S: -90 E: 180 W: -180 N: 72 S: 55 E: -130 W: -156 |
LAS | |
| ICESat-2 L4 Grounding Zone for Antarctic Ice Shelves V001 | 1 | ICESat-2 | ATLAS | 2019-03-30 to 2020-09-30 |
N: -60 S: -90 E: 180 W: -180 |
HDF5, JPEG |
Featured Observation Glaciers/Ice Sheets Method: ASTER
The Advanced Spaceborne Thermal Emission and Reflection Radiometer (ASTER) is a high spatial resolution instrument aboard the Terra satellite. ASTER captures images of Earth in 14 different wavelengths from visible to thermal infrared light as well as provides a Global Digital Elevation Model (GDEM) of the planet's land surface with 30-meter resolution. ASTER data can be used to create detailed visualizations and maps of land surface temperature, emissivity, reflectance, and elevation including images of glaciers.
The final processing of Advanced Spaceborne Thermal Emission and Reflection Radiometer (ASTER) data will make its archive more accessible to users.
8 MIN READ
The Global Land Ice Measurements from Space (GLIMS) initiative uses satellite data to track glacier changes, providing vital data for climate and hazard studies.
See ASTER instrument images revealing the transformation of South Korea's Mount Gariwang for the 2018 Winter Olympics.
Version 3 of the ASTER Global Digital Elevation Model (GDEM) provides new features and sharper imagery.
Glaciers/Ice Sheets Data Tools
| Tool Sort descending | Description | Services | |
|---|---|---|---|
| GLIMS Glacier Database | Visualize and download data from the GLIMS Glacier Database using the map-based GLIMS Glacier Viewer or search and download data using custom parameters in the GLIMS Text Search Interface. | Downloading, Search and Discovery, Visualization | |
| RTC Stack Processor | The radiometric terrain correction (RTC) stack processor tool facilitates time-series analysis of such phenomena as flooding events, deforestation, or glacier retreat. | Analysis, Processing, Search and Discovery, Visualization | |
| Vertex | Vertex is a graphical search interface for finding synthetic aperture radar (SAR) data. | Search and Discovery, Access, Downloading, Processing, Subsetting |
SHOWING 3 OF 3
Frequently Asked Questions
Earthdata Forum
Our online forum provides a space for users to browse thousands of FAQs about research needs, data, and data applications. You can also submit new questions for our experts to answer.
Submit Questions to Earthdata Forumand View Expert Responses