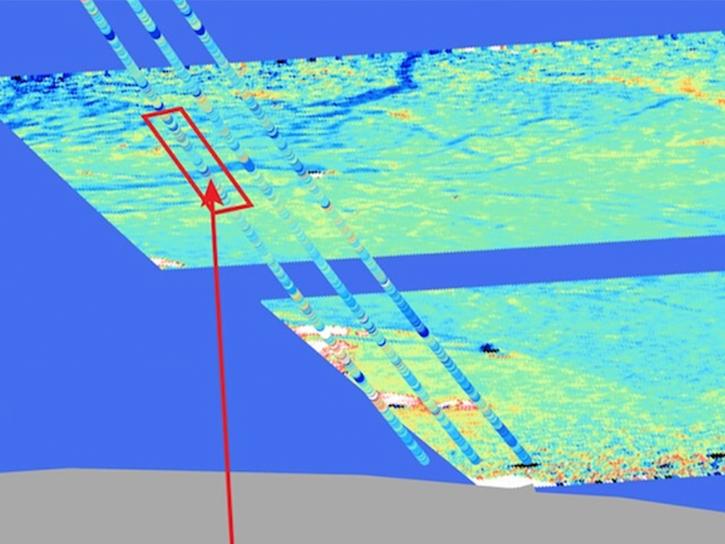
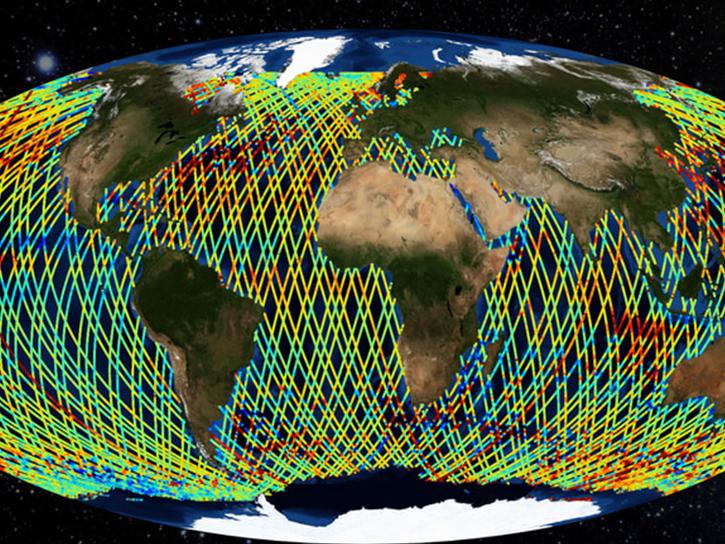
NASA data span the geophysical parameters that characterize the global ocean and the physical processes operating within its depths and at its surface. Our datasets and tools help researchers translate these interconnected data points into actionable knowledge.
Ocean Data Access and Tools
Ocean Datasets
| Dataset Sort descending | Version | Platform | Instrument | Temporal Extent | Spatial Extent | Spatial Resolution | Data Format |
|---|---|---|---|---|---|---|---|
| SASSIE ECCO Sea-Ice and Snow Horizontal Volume and Area Fluxes - Daily Mean llc1080 Grid (Version 1 Release 1) | V1R1 | MITgcm | 2014-01-15 to 2021-02-08 | NETCDF4 | |||
| SASSIE ECCO Sea-Ice and Snow Horizontal Volume and Area Tendencies - Daily Mean llc1080 Grid (Version 1 Release 1) | V1R1 | MITgcm | 2014-01-15 to 2021-02-08 | NETCDF4 | |||
| SCATSAT-1 ESDR Level 2 Ancillary Ocean Surface Fields Version 1.1 | 1.1 | MODELS, SCATSAT-1 | Computer, OSCAT-2 | 2018-04-01 to 2021-03-01 |
N: 90 S: -90 E: 180 W: -180 |
12.5 Kilometers x 12.5 Kilometers | netCDF-4 |
| SCATSAT-1 Inter-Calibrated ESDR Level 2 Observed and Modeled Spatial Derivatives of Surface Wind and Wind Stress Version 1.0 | 1.0 | SCATSAT-1 | OSCAT-2 | 2018-04-01 to 2021-03-01 |
N: 90 S: -90 E: 180 W: -180 |
12.5 Kilometers x 12.5 Kilometers | netCDF-4 |
| SCATSAT-1 Scatterometer Inter-Calibrated ESDR Level 2 Ocean Surface Equivalent Neutral Wind Vectors and Wind Stress Vectors Version 1.1 | 1.1 | SCATSAT-1 | OSCAT-2 | 2018-04-01 to 2021-03-01 |
N: 90 S: -90 E: 180 W: -180 |
12.5 Kilometers x 12.5 Kilometers | netCDF-4 |
| SCATSAT-1 Scatterometer Inter-Calibrated ESDR Level 3 Ocean Surface Equivalent Neutral Wind Vectors and Wind Stress Version 1.0 | 1.0 | SCATSAT-1 | OSCAT-2 | 2018-04-01 to 2021-03-01 |
N: 90 S: -90 E: 180 W: -180 |
0.125 Decimal Degrees x 0.125 Decimal Degrees | netCDF-4 |
| SCOAPE R/V Point Sur Data | 1 | R/V Point Sur | CEILOMETERS, SUN PHOTOMETERS, AETHALOMETER, ANEMOMETERS, PYRANOMETERS | 2019-05-09 to 2019-05-19 | NetCDF-3, ICARTT | ||
| Scotia Prince ferry dataset | 0 | BUOYS, MOORINGS, Water-based Platforms, AUVS, ROVS, Ships | 1998-06-06 to Present |
N: 90 S: -90 E: 180 W: -180 |
|||
| Scripps Ocean Institute (SOI) pier measurements | 0 | BUOYS, MOORINGS, Water-based Platforms, AUVS, ROVS, Ships | 2007-04-04 to Present |
N: 90 S: -90 E: 180 W: -180 |
|||
| Sea Level Rise Impacts on Ramsar Wetlands of International Importance | 1.0 | MODELS | Computer | 2000-01-01 to 2010-12-31 |
N: 85 S: -58 E: 180 W: -180 |
Excel, WMS | |
| Sea Surface Temperature (SST) CPEX | 1 | SATELLITES | Computer | 2017-05-23 to 2017-07-15 |
N: 39.996 S: 5.004 E: 179.5 W: 178.896 |
||
| Sea to Space expedition | 0 | BUOYS, MOORINGS, Water-based Platforms, AUVS, ROVS, Ships | 2017-01-26 to Present |
N: 90 S: -90 E: 180 W: -180 |
|||
| Seaglider CTD data for the SPURS-1 N. Atlantic field campaign | 1.0 | SEAGLIDER | CTD | 2012-09-13 to 2013-08-24 |
N: 26 S: 23 E: -34 W: -39 |
1 Meters x 1 Meters | netCDF-4 |
| SeaHawk-1 HawkEye Level-1A Data, version 1 | 1 | SeaHawk-1 | HawkEye | 2018-12-03 to 2023-10-27 |
N: 90 S: -90 E: 180 W: -180 |
netCDF-4 | |
| SeaHawk-1 HawkEye Level-2 Regional Ocean Color (OC) Data, version 2022.0 | 2022.0 | SeaHawk-1 | HawkEye | 2019-03-21 to 2023-10-27 |
N: 90 S: -90 E: 180 W: -180 |
netCDF | |
| Seasat Level 1 Synthetic Aperture Radar Products | 1 | SEASAT 1 | SAR | 1978-07-04 to 1978-10-12 | GeoTIFF, HDF5, XML, KML, Text File | ||
| SEASAT SCATTEROMETER DEALIASED OCEAN WIND VECTORS (Atlas) | 1 | SEASAT 1 | SASS | 1978-07-07 to 1978-10-10 |
N: 90 S: -90 E: 180 W: -180 |
100000 Meters x 100000 Meters | RAW |
| SEASAT SCATTEROMETER DEALIASED OCEAN WIND VECTORS (JPL-UCLA-AES) | 1 | SEASAT 1 | SASS | 1978-07-07 to 1978-10-11 |
N: 70 S: -70 E: 180 W: -180 |
1 Decimal Degrees x 1 Decimal Degrees | ASCII |
| SEASAT SCATTEROMETER DEALIASED OCEAN WIND VECTORS (Wentz et al.) | 1 | SEASAT 1 | SASS | 1978-07-07 to 1978-10-10 |
N: 90 S: -90 E: 180 W: -180 |
100000 Meters x 100000 Meters | RAW |
| SEASAT SCATTEROMETER DERIVED GLOBAL GRIDDED MONTHLY OCEAN WIND STRESS (Chelton) | 1 | SEASAT 1 | SASS | 1978-07-07 to 1978-10-10 |
N: 70 S: -70 E: 180 W: -180 |
2.5 Decimal Degrees x 2.5 Decimal Degrees | ASCII |
| Seasoar CTD data for the SPURS-1 N. Atlantic field campaign | 1.0 | Seasoar | CTD | 2013-03-22 to 2013-04-08 |
N: 26 S: 22 E: -36 W: -39 |
1 Meters x 1 Meters | netCDF-4 |
| SeaWiFS Global Mapped Eulerian and Lagrangian Oceanography and Ecology Variables Data, version 1 | 1 | OrbView-2 | SeaWiFS | 1997-09-04 to 2010-12-11 |
N: 90 S: -90 E: 180 W: -180 |
netCDF-4 | |
| SEDIMENT ANALYSIS NETWORK FOR DECISION SUPPORT (SANDS) LANDSAT GEOLOGICAL SURVEY OF AL (GSA) ANALYSIS V1 | 1 | LANDSAT-7, LANDSAT-5 | ETM+, MSS, TM | 2000-09-11 to 2008-09-08 |
N: 31 S: 27 E: -84.25 W: -90 |
Multiple | |
| SEDIMENT ANALYSIS NETWORK FOR DECISION SUPPORT (SANDS) LANDSAT GEOTIFF V1 | 1 | LANDSAT-7, LANDSAT-5 | ETM+, MSS, TM | 2000-09-11 to 2008-09-08 |
N: 31.417 S: 27.8502 E: -82.6518 W: -91.7794 |
ASCII, TIFF | |
| SEDIMENT ANALYSIS NETWORK FOR DECISION SUPPORT (SANDS) MODIS GEOLOGICAL SURVEY OF AL (GSA) ANALYSIS V1 | 1 | Terra, Aqua | MODIS | 2000-09-14 to 2008-09-08 |
N: 31 S: 27 E: -84.25 W: -90 |
ASCII, JPEG, Excel, PDF |
Surface Water and Ocean Topography (SWOT) Platform
SWOT provides detailed surface topography and monitors water body changes over time. The platform enables high-resolution ocean monitoring at 15-150 km spatial scales, tracking ocean currents, coastal dynamics, storm surges, and regional sea level changes. On land, SWOT measures water storage changes in lakes, reservoirs, rivers, and wetlands, supporting river discharge estimates for water resource assessment.
Ocean Data Tools
| Tool Sort descending | Description | Services | |
|---|---|---|---|
| SOTO | State of the Ocean (SOTO) is an interactive web-based tool that generates informative maps, animations, and plots that communicate and prove the discovery and analysis of the state of the oceans. | Analysis, Search and Discovery, Visualization | |
| STREAM | STREAM is a rapid water quality monitoring tool that processes satellite imagery to create maps showing chlorophyll-a, Total Suspended Solids, and water clarity at 20-30 meter resolution. | Processing | |
| SWOT Swath Visualizer | The Surface Water and Ocean Topography (SWOT) Swath Visualizer provides a visualization of two instruments’ coverage of Earth's surface: the Ka-band Radar Interferometer and altimeter. | Analysis, Data Curation, Visualization | |
| Worldview | Worldview offers the capability to interactively browse over 1,200 global, full-resolution satellite imagery layers and download the underlying data. | Analysis, Search and Discovery, Visualization, Access, Comparison, Monitoring Natural Events |
Pagination
- 1
- 2
Frequently Asked Questions
Earthdata Forum
Our online forum provides a space for users to browse thousands of FAQs about research needs, data, and data applications. You can also submit new questions for our experts to answer.
Submit Questions to Earthdata Forumand View Expert Responses